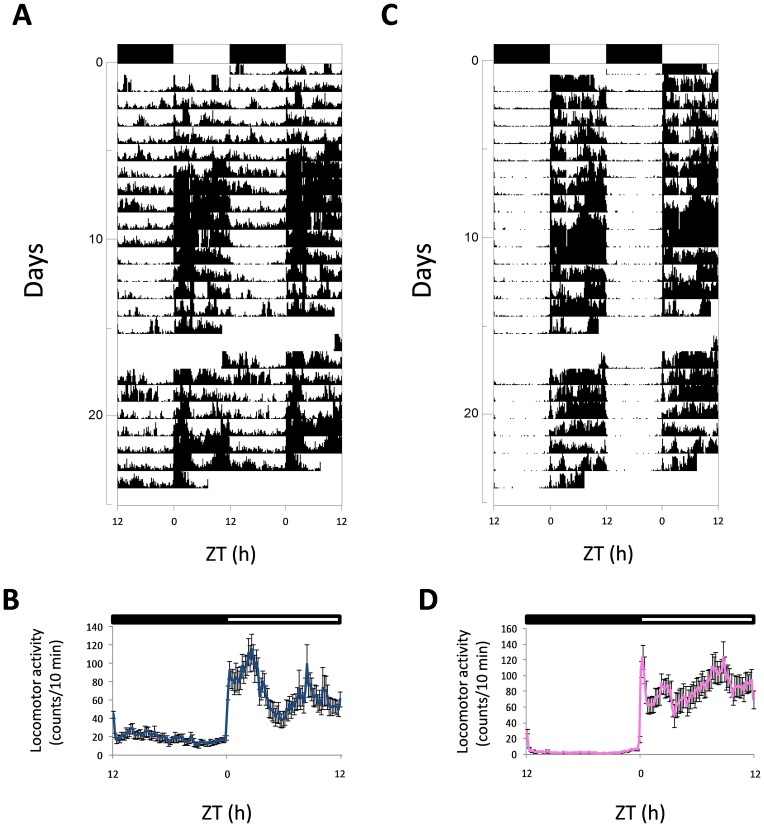
Fig 1. Representative actograms and mean waveforms of locomotor activity of zebrafish males (A, B) and females (C, D).
Zebrafish were subjected to 12:12 LD and fed daily at ZT 4 h. Actograms were double-plotted (time scale 48 h). The height of each point represents the number of infrared light-beam interruptions/10 min. Each horizontal line shows one experimental day on the vertical axis, and the hours of the day are represented on the X-axis. The black bar at the top of each actogram represents the dark phase, and the white one represents the light phase of the LD conditions. In the meanwaves, each point was calculated as the mean±S.D from the 10-minute binned data across all the experimental days. Each waveform is represented as single-plotted.

