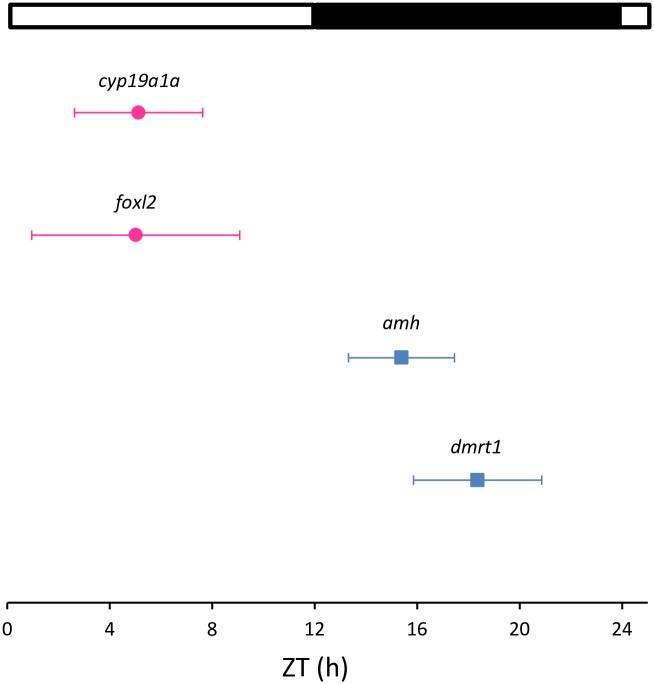
Fig 3. Map of acrophases.
Only the genes that displayed a statistically significant daily rhythm (Cosinor, p<0.05) are included in the graph. The acrophase is indicated by symbols and the fiducial limits (set at 95%) are indicated by lateral bars. The pink circles and blue squares indicate the genes analyzed in the ovary and testes, respectively. The white and black bars above the graph represent the light and dark phase, respectively.

