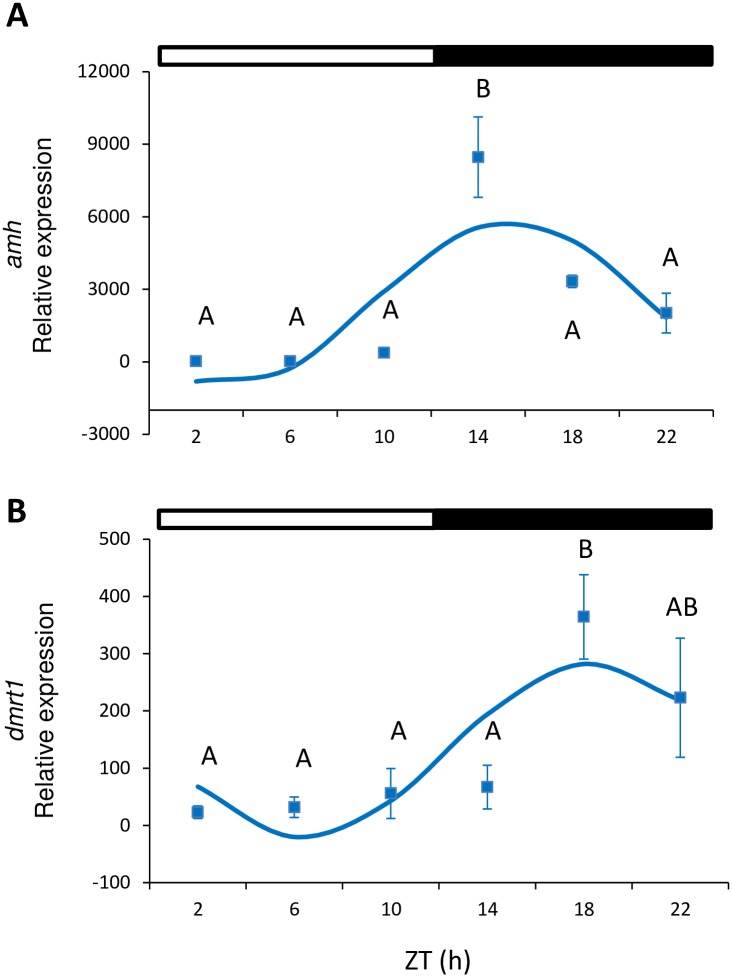
Fig 4. Relative gene expression of amh (A) and dmrt1 (B) in testes.
Squares indicate the relative gene expression (mean±SEM) at each sampled time point. Different capital letters indicate the statistically significant differences between time points (one-way ANOVA, p<0.05). The sinusoidal curve calculated by Cosinor (p<0.05) is indicated by the continuous line. The white and black bars above the graphs represent the light and dark phase, respectively.

