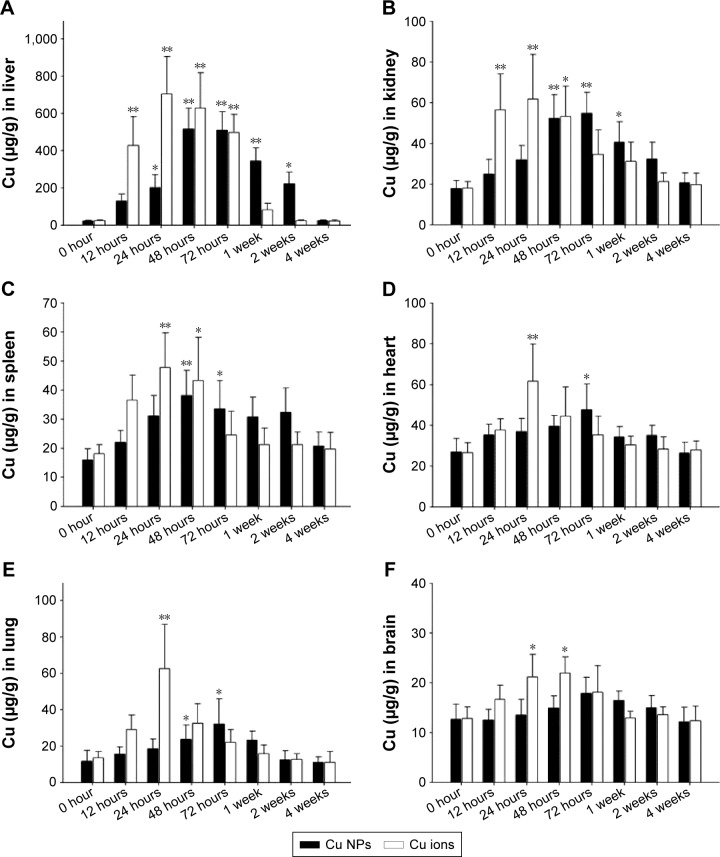
Figure 3.
Biodistribution of Cu from Cu NPs and Cu ions.
Notes: Cu levels in (A) liver, (B) kidney, (C) spleen, (D) heart, (E) lung, and (F) brain in the Cu NP- and Cu ion-treated rats are determined at 0 hour (control), 12 hours, 24 hours, 48 hours, 72 hours, 1 week, 2 weeks, and 4 weeks after a single oral dose of 500 mg/kg each. Values are presented as mean ± SD (n=3). *P<0.05, **P<0.01 vs vehicle control. Cu ions, copper(II) chloride.
Abbreviations: Cu NPs, copper nanoparticles; SD, standard deviation.

