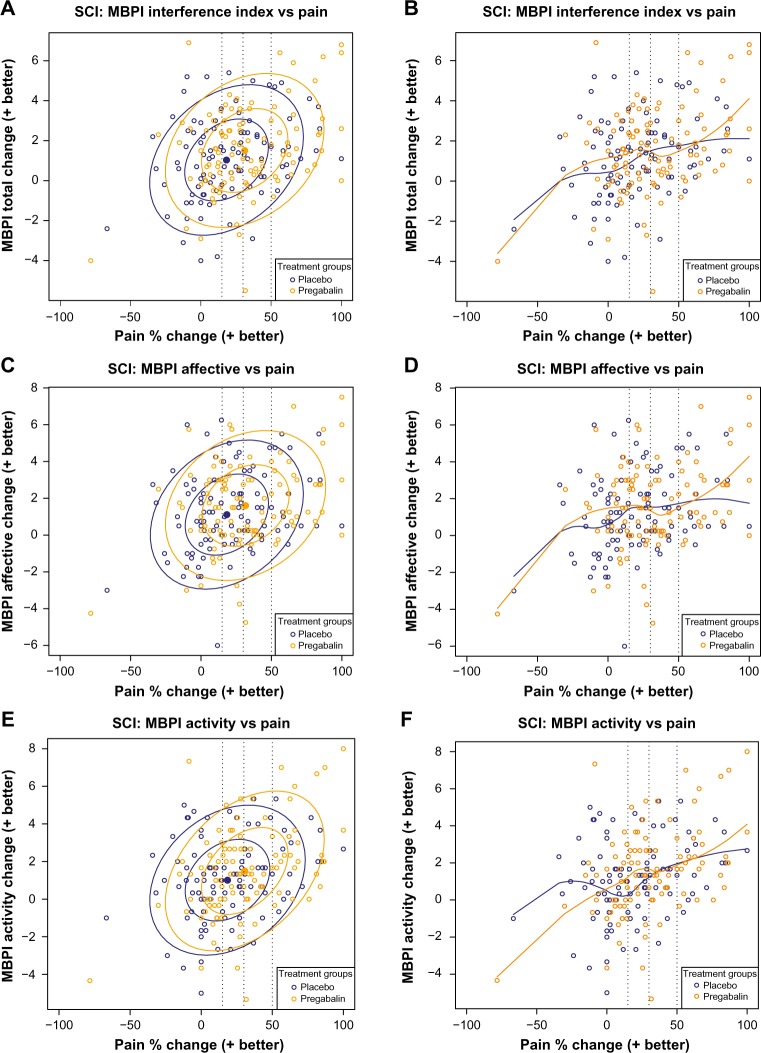
Figure 1.
Scatter plots of the relationship between pain reduction and pain interference with function assessed by the ten-item MBPI Total Interference score (A and B) and the Affective (C and D) and Activity (E and F) subscales derived from the seven-item BPI.
Notes: Data are for patients in Cardenas et al.14 Panels on the left show bivariate data ellipses at 50% and 95% confidence regions for the observed spread and strength of the relationship between pain and function. Panels on the right are loess curves exploring the extent of the relationship. Broken vertical lines indicate clinically relevant pain improvement thresholds of 15%, 30%, and 50%.
Abbreviations: MBPI, modified Brief Pain Inventory; SCI, spinal cord injury.

