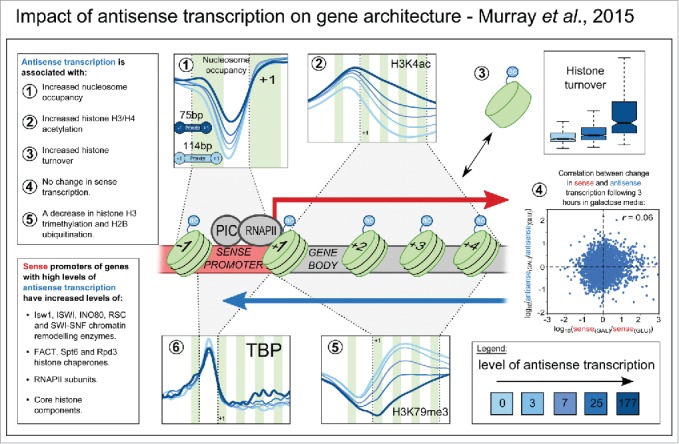
FIGURE 2.

A summary of the findings presented in Murray et al.9 Shown are the average levels of nucleosome occupancy (1), H3K4 acetylation (2), histone turnover (3), H3K79me3 (5) and TBP (6) in 5 different gene classes selected on the basis of their level of antisense transcription. The median level of antisense transcription in these groups relative to one another is shown in the bottom right inset. Also shown in (4) is a scatter plot of the change in sense transcription versus the change in antisense transcription in 5,183 S. cerevisiae genes following a change in growth conditions (a shift from glucose- to galactose-containing medium). Green vertical strips represent approximate positions of nucleosomes. Arrows show the direction of sense and antisense transcription (red and blue respectively). PIC = pre-initiation complex. RNAPII = RNA polymerase II. TBP = TATA-box binding protein.
