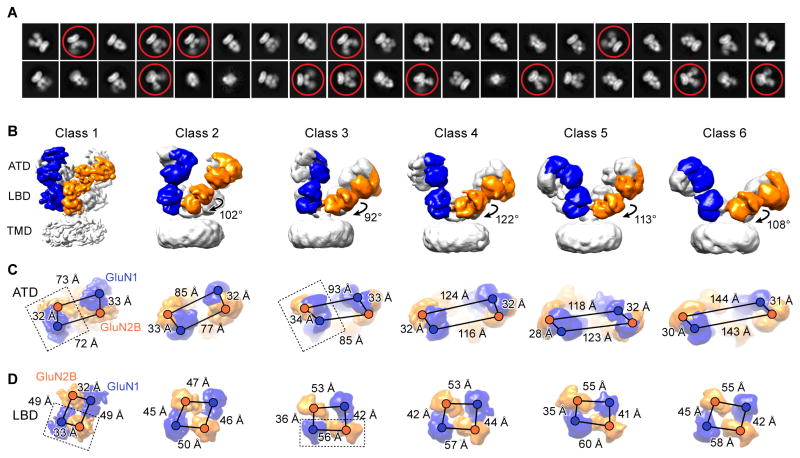
Figure 1. Cryo-EM Structures of Antagonist-Bound Receptors.
(A) Representative 2D class average images of the DCKA/D-APV-bound state. Conformational heterogeneity with highly mobile extracellular domains are circled. (B) Six distinct classes of three-dimensional reconstruction density maps of DCKA/D-APV-bound GluN1-GluN2B (one subunit of each highlighted in blue and orange, respectively), showing antagonist-induced conformational changes of the ECDs. Rotation angles based on the inertial axis of mass weighting of the GluN2B-LBDs between the class 1 and the other five classes are indicated. (C–D) Measurements of the distances from the center of masses (shown as spheres) between GluN1 and GluN2B subunits are indicated by scale bars for the classes represented above. (C) The distances between the heterodimers in the ATD layer increase, while the distances within the dimer remain relatively unchanged. (D) The distance changes result in a transition from a twofold to a pseudo-fourfold symmetry on the LBD layer. The dimer units are highlighted by dashed box in class 1 and class 3. Views are ‘top down’ in (C) and (D).

