
Figure 2. Competitive Antagonist Binding Induces Clamshell Conformational Changes.
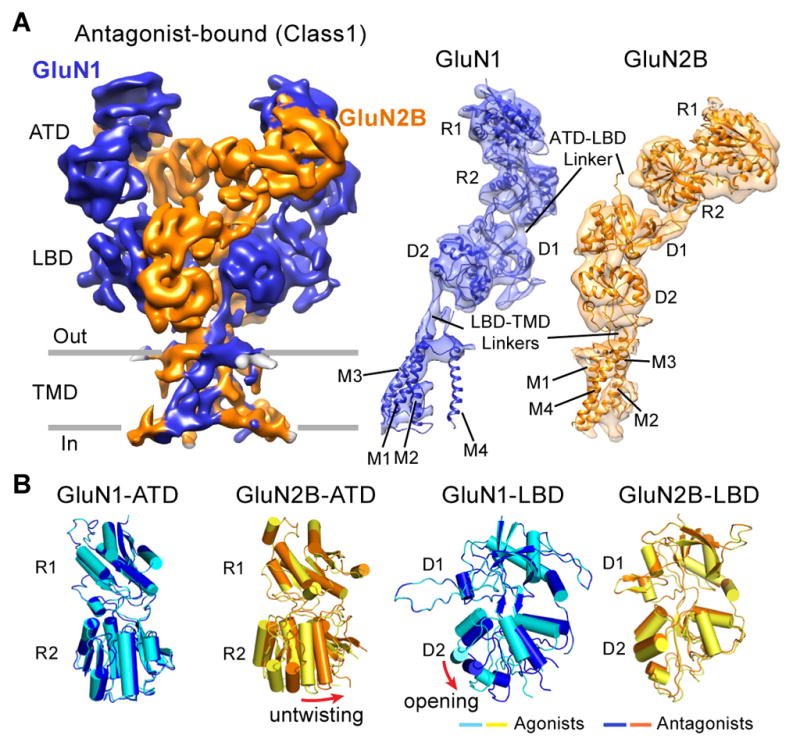
(A) The 3D reconstruction density map of the DCKA/D-APV-bound GluN1-GluN2B receptor (in blue and orange, respectively), referring to class 1 in figure 1. View is perpendicular to the overall 2-fold axes of symmetry. Right panels are corresponding coordinate fits into the reconstruction map of the R1/R2 lobes of ATD, D1/D2 lobes of LBD, and TMD of the GluN1 or GluN2B subunits, independently. (B) Superimposition of the R1 lobes of the antagonist- and agonist-bound GluN1-ATD and GluN2B-ATD models (left panels), showing the untwisting motions of the GluN2B R2 lobe in the antagonist-bound state. Superimposition of the D1 lobes of the antagonist- and agonist-bound states of the GluN1-LBD and GluN2B-LBD models (right panels), showing the opening of the GluN1 D2 lobe in the DCKA-bound state.