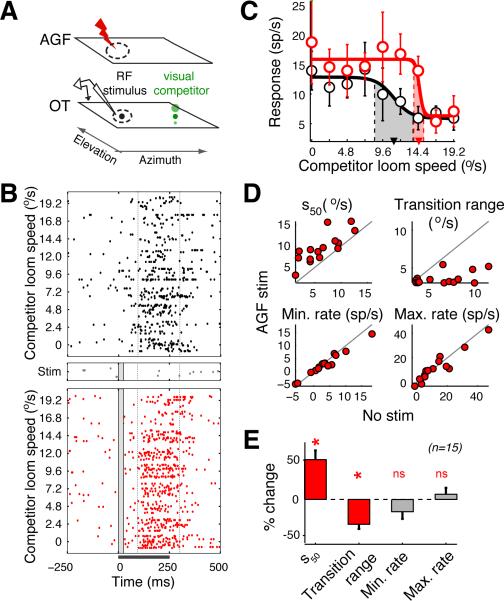
Figure 1. Effects of spatially congruent AGF microstimulation on the encoding of the highest priority stimulus.
(A) Schematic of experimental protocol. Illustrated are the representations of space in the OTid and AGF, receptive fields (dashed ovals), electrodes in the OTid (recording icon) and AGF (red lightning bolt), and visual stimuli (black and green dots); both stimuli were presented in the same hemifield. Size of dot: strength (loom speed) of stimulus. (B) Rasters of spike responses of an OTid neuron to the competition protocol without (top panel) and with spatially aligned AGF microstimulation (bottom panel). Also shown are responses to microstimulation alone, delivered in the absence of sensory stimuli (middle panel). Bar underneath the x-axis represents the time of stimulus presentation; vertical box within raster plot indicates the onset and duration of AGF microstimulation. Dashed vertical lines indicate the time window (100-300 ms) during which response firing rates were measured. Distance between the centers of OTid and AGF RFs = 5°; loom speed (strength) of RF stimulus = 10.4°/s; strength of microstimulation current = 20 μA. (C) CRPs without (black) and with (red) aligned AGF microstimulation; computed from the rasters in B. Solid lines: best sigmoidal fits to CRPs; arrowheads: s50; shaded areas: transition ranges. RF stimulus strength = 10.4°/s. Data represent mean ± s.e.m. (D) Scatter plots of values of sigmoidal parameters without vs. with aligned AGF microstimulation. Circles: individual neurons; n=15 neurons from 3 birds. Grey line: line of equality. Average distance between the centers of OTid and AGF RFs = 5° ± 0.8°; average distance between OTid RF center and competitor location = 35° ± 1.2°; Fig. S1E. Average strength of the RF stimulus = 6.9 °/s ± 0.5 °/s; average strength of microstimulation current =13.5 ± 1.3 μA; data: mean ± s.e.m. (E) Population summary of the effects of aligned AGF microstimulation on the parameters of the CRP. ‘*’: p<0.05, ‘ns’: not significant. S50: Wilcoxon signed rank test (“rank-test”), p<10−3, signed rank = 1; transition range: rank-test, p<10−3, signed rank =1; minimum rate: t-test, p=0.29, t14=1.12; maximum rate: t-test, p= 0.81, t14=0.24). Data: mean ± s.e.m. See also Figure S1.

