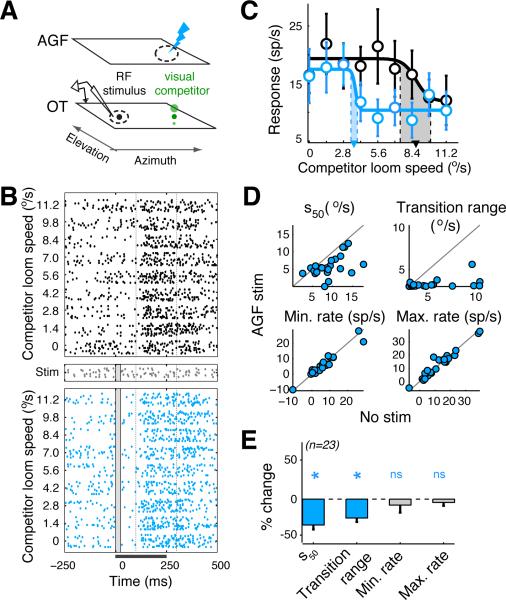
Figure 2. Effects of spatially non-congruent AGF microstimulation on the encoding of the highest priority stimulus.
(A-E) Same conventions as in Figure 1. (A) Blue lightning bolt: AGF microstimulation non-aligned with OTid RF but aligned with location of competitor stimulus. (B) Rasters of spike responses of an OTid neuron to the competition protocol without (top panel) and with spatially non-congruent AGF microstimulation (bottom panel). Distance between OTid RF center and AGF RF center/location of competitor = 28.9°; loom speed (strength) of RF stimulus = 4.8°/s; strength of microstimulation current = 10 μA. (C) CRPs without (black) and with (blue) non-aligned AGF microstimulation; computed from the rasters in B. (D) Scatter plots of values of sigmoidal parameters without vs. with non-aligned AGF microstimulation. Circles: individual neurons; n=23 neurons from 7 birds. Average distance between OTid RF center and AGF RF center/ location of competitor = 37.3° ± 3.3; Fig. S2E. Average strength of the RF stimulus = 7.7 °/s ± 0.35 °/s; average strength of microstimulation current =16.5 ± 0.7 μA; data: mean ± s.e.m. (E) Population summary of the effects of aligned AGF microstimulation on the parameters of the CRP. S50: t-test, p<10−3, t22 = -4.55; transition range: t-test, p<10−3, t22 = -4.83; minimum rate: rank-test, p=0.93, signed rank = 135; maximum rate: rank-test, p= 0.78, signed rank = 129. Data: mean ± s.e.m.
See also Figure S2.

