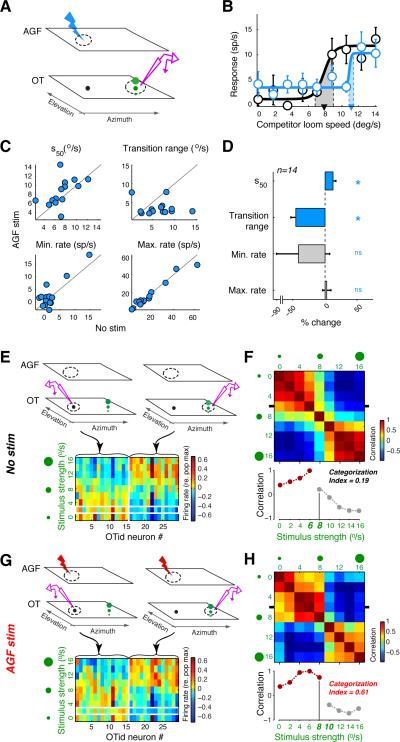
Figure 3. Effects of AGF microstimulation on the ensemble coding of the highest priority stimulus in the OTid.
(A-D) Responses of OTid neurons that encode the competitor stimulus in the competition protocol in Figure 1A. Same conventions as in Figure 1. (A) Schematic of the experimental protocol. Configuration of the sensory stimuli is a mirror image of the configuration in Figure 1A. The microstimulation site in the AGF continues to encode the location of the stimulus of fixed strength (as in Figure 1A). (B) Responses of an OTid neuron without (black) and with (blue) AGF microstimulation; strength of the fixed-strength stimulus= 7 °/s. (C) Scatter plots of values of sigmoidal parameters without vs. with AGF microstimulation. (D) Population summary (14 neurons from 5 birds). Data represent mean ± s.e.m. ‘*’: p<0.05, ‘ns’: not significant (s50: rank-test, p=0.017, signed rank=15; transition range: rank-test, p<10−3, signed rank = 4; minimum rate: rank-test, p=0.58, signed rank = 43; maximum rate: p= 0.32, t-test, t13=1.03).
(E-H) Effect of AGF microstimulation on the OTid ensemble code (E,F) OTid ensemble code in the absence of AGF microstimulation. (E) Top, left: Schematic illustrating measurement of responses of OTid neurons that encoded the RF stimulus (recording icon highlighted in purple). Top, right: Schematic illustrating measurement of responses of OTid neurons that encoded the competitor stimulus. Bottom: Matrix of ensemble OTid activity constructed from responses of neurons encoding the RF stimulus (n=15) and those of neurons encoding the competitor stimulus (n=14; panels A-D; Experimental Procedures). Columns = neurons; rows = strengths of the competitor stimulus. (F) Top: Matrix of pairwise correlations (Pearson) between rows of the activity matrix in E. Bottom: Horizontal transect through the correlation matrix at the position indicated by the tick marks in the top panel. X-axis labels = competitor strengths. Population category boundary is indicated by the abrupt transition seen between the competitor strengths of 6 °/s and 8 °/s (near the RF stimulus strength of 7.2 °/s; Experimental Procedures). Brown and grey data: the two categories; vertical grey line aids visualization of the right-shifting boundary (compare with H, bottom panel). Categorization index (Mysore and Knudsen, 2011) represents the quality of categorization (Experimental Procedures; Fig. S3). (G,H) OTid ensemble code in the presence of space-specific AGF microstimulation (data for each neuron in a and b obtained in a randomly interleaved manner). Same conventions as in E,F.
(H) Population category boundary is shifted over to the right relative to the boundary in F, occurring now between competitor strengths of 8°/s and 10°/s.
See also Figure S3.

