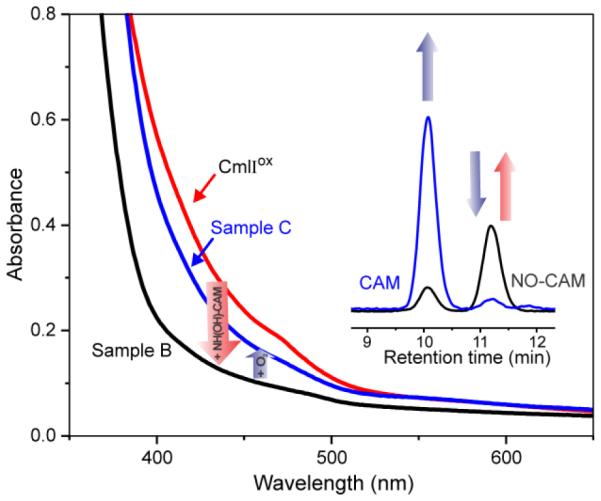
Figure 3.

Optical absorbance spectra and product analysis in the reaction of 560 μM NH(OH)-CAM with 560 μM anaerobic CmlIox (red spectrum), which yields Sample B (black spectrum) which contains NO-CAM product (black HPLC trace). Addition of O2 yields Sample C (blue spectrum) which contains primarily CmlIox and CAM product (blue HPLC trace). Buffer: 50 mM Bicine, pH 9, 4 °C.
