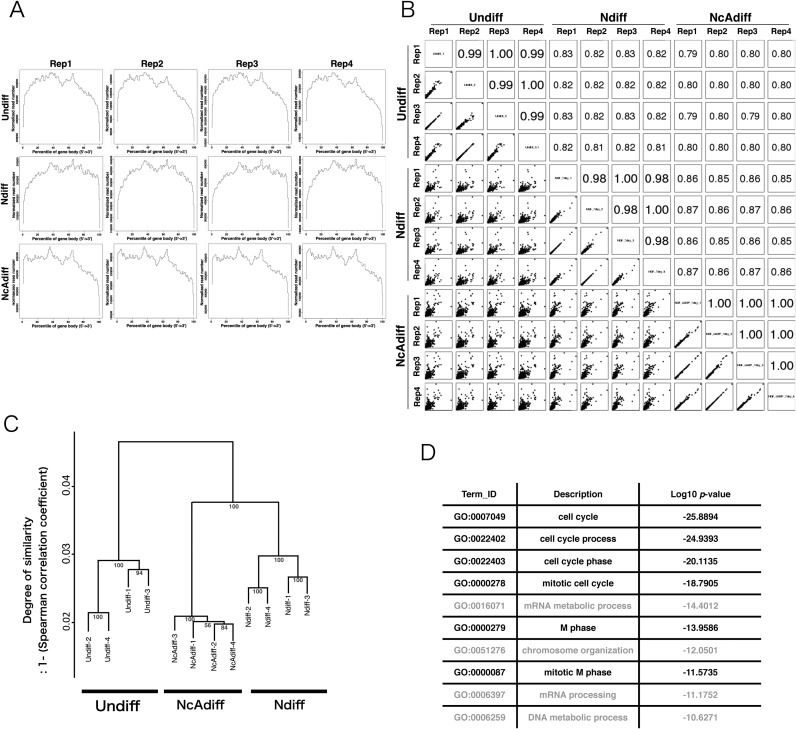
Figure 2.
A significant number of M-phase associated genes were not stringently repressed in Ndiff cells. (A) Density plots of directional RNA-seq reads mapped to the RefSeq genes to evaluate 5′-3′ potential mapping bias across genes. Each sample category consisted of four replicates (Rep1–4). (B) Scatter plots of gene expression levels and Pearson correlation coefficients among all sequenced samples. The expression levels of genes were calculated based on the number of reads mapped to each Ensembl protein-coding gene normalized by iDEGES/edgeR methods. (C) Hierarchical clustering of sequence data sets based on the expression levels of Ensembl protein-coding genes. The distance between samples was determined by clustering using group average methods and linkage criteria based on Spearman's rank coefficient of correlation. The numbers in tree diagrams are approximately unbiased P-values. (D) The top 10 most significantly enriched GO terms for 3346 Ndiff-specific protein-coding genes. The P-value is the Benjamini–Hochberg corrected P-value.

