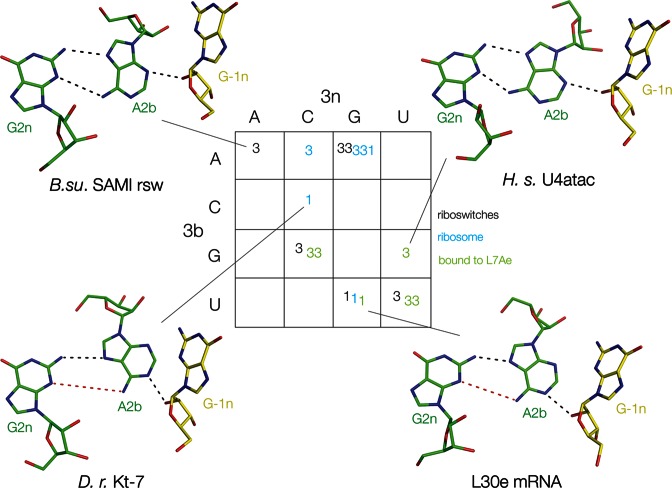
Figure 2.
The naturally-occurring k-turns of known structure classified as N3 or N1 conformations as a function of their 3b,3n sequences. In this and subsequent figures, the k-turns are placed within the cells of a 4 × 4 array according to their 3b (rows) and 3n (columns) sequences. Here, the conformation of each k-turn is shown as N3 (3) or N1 (1) conformation. The origin of each k-turn is shown as riboswitch (black), ribosome (cyan) or as an L7Ae complex (green). The structures of the 2b•2n•-1n triple base interactions are shown for four of these k-turns. Hydrogen bonds are indicated by black broken lines. Red broken lines indicate distances too long to be hydrogen bonded.

