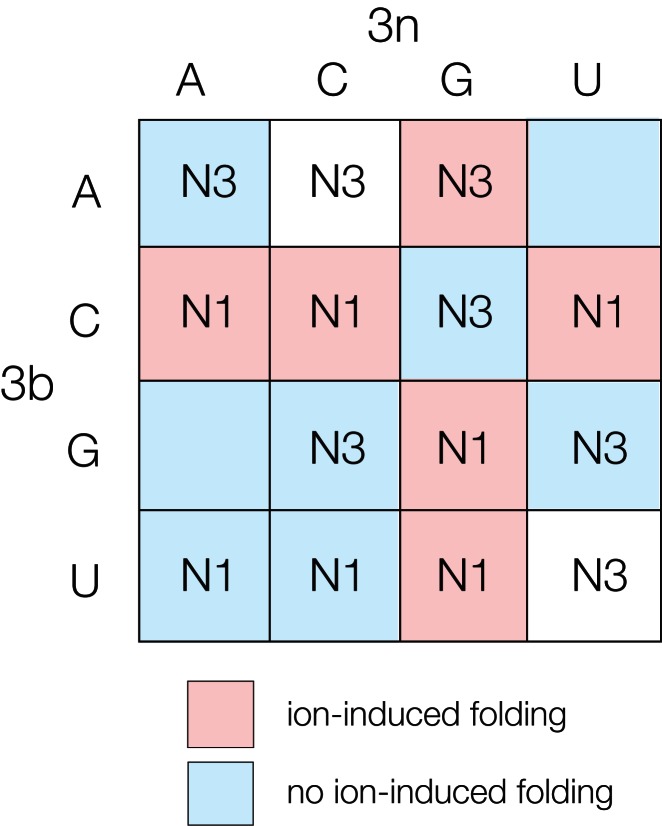
Figure 4.
Summary of the conformation and folding characteristics of k-turns according to their 3b,3n sequences. Each cell of the array is labeled with the N3 or N1 conformation associated with that 3b,3n sequence where determined. The cells are colored by the ability of those k-turns to undergo ion-induced folding (11). k-turns that undergo folding on addition of metal ions alone are colored red, while those that do not are colored blue.

