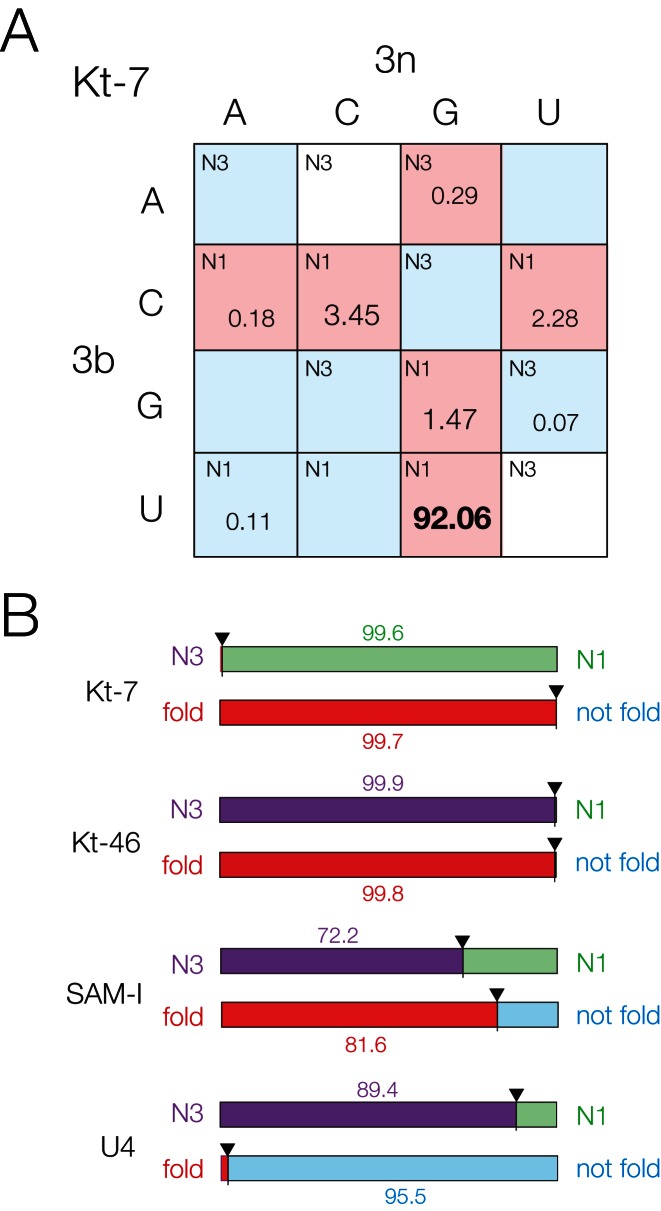
Figure 6.
Bioinformatic analysis of four natural k-turns according to their 3b,3n sequences. (A) The distribution of 2722 natural k-turn sequences of bacterial Kt-7 according to the 3b,3n sequences. Each cell is indicated by its preferred conformation (N3 or N1), and colored by its ion-induced folding properties. The fraction of Kt-7 sequences (as a percentage of the total) for each 3b,3n sequence is indicated for non-zero values. The largest fraction (3b,3n = U•G, 92.06%) is highlighted bold. The 4 × 4 arrays are shown for all four k-turns analyzed in Supplementary Figure S7. (B) Bar plots summarizing the deduced conformation and folding preferences for bacterial Kt-7, Kt-46, SAM-I riboswitch and U4 snRNA k-turns. For each k-turn type two plots are shown. The upper one indicates the probable fractional population of N3 (purple) versus N1 (green) conformation, while the lower plot indicates the likely ion-induced folding characteristics between folding (red) and non-folding (blue) in metal ions. These properties are deduced on the basis of the application of the rules indicated by Figure 4. In each case the bars are labeled with the percentage of the larger fraction.

