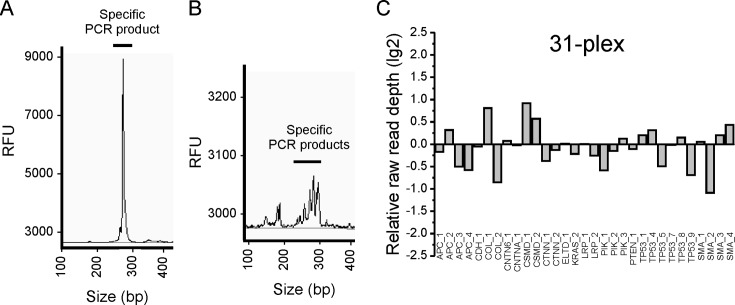
Figure 3.
Library purity and uniformity. (A) Electropherogram of a purified final library targeting one DNA sequence using the Fragment Analyzer. (B) Electropherogram of a purified final library targeting 31 DNA sequences using the Fragment Analyzer. (C) Relative raw read depth of 31 multiplexed amplicons were analyzed. DNA from tumor cell line CP-A was used. The average raw read depth was 1.4 × 10⁴ per amplicon.

