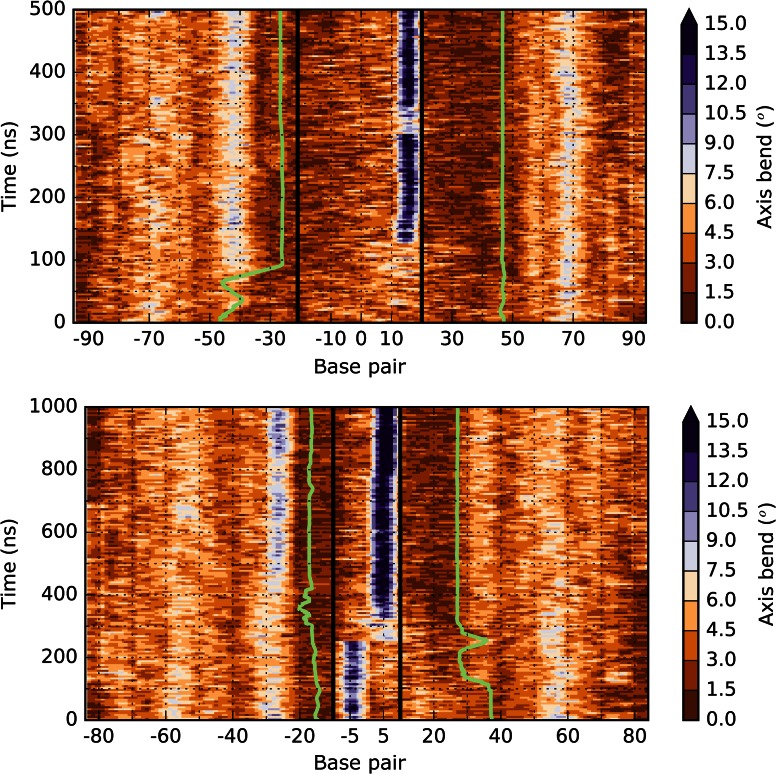
Figure 3.
Time evolution of the DNA axis bend. Axis bend values at each base-pair step along the MD trajectories of IN42 (top) and IN21 (bottom). Black lines delimit the DNA inserts and green lines indicate loop DNA that is detached from the protein core. White and blue regions indicate increasing DNA bending.

