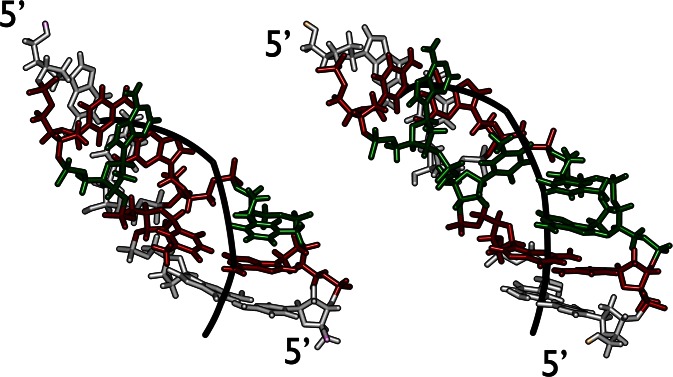
Figure 5.
Kinked structures. Structures of Type II (left) and Type III (right) kinks extracted from the simulation of the IN21 structure. DNA is shown as grey sticks; base pairs are colored green if they are broken and red if they are intact but feature large negative values of roll with one of their neighbors. The Curves+ helical axis is shown as a thick black line.

