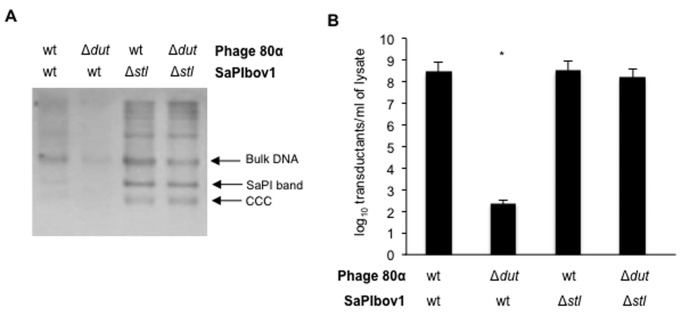
Figure 4.
Effect of stl mutation in SaPIbov1 replication and transfer. (A) Southern blot after induction of 80α wt or 80α Δdut mutant prophages. Samples were isolated 60 min after induction with mitomycin C of the different lysogenic strains carrying SaPIbov1 tst::tetM (wt) or SaPIbov1 Δstl tst::tetM (Δstl). The samples were separated on an agarose gel and blotted with a SaPIbov1-specific probe. The upper band is ‘bulk’ DNA, including chromosomal, phage and replicating SaPI. The intermediate band is SaPI linear monomers released from phage heads. The lower band corresponds to the covalently closed circular (CCC) SaPIbov1 molecules. (B) The figure shows the number of transductants (log10) per milliliter of induced culture, using RN4220 as recipient strain. The means of results from three independent experiments are presented. The frequency observed in the Δdut mutant is typical of transfer by generalized transduction and is not SaPI specific. Yates' chi-squared test was used to compute P values for between-group comparisons; differences that are statistically significant are indicated by an asterisk (P < 0.001).

