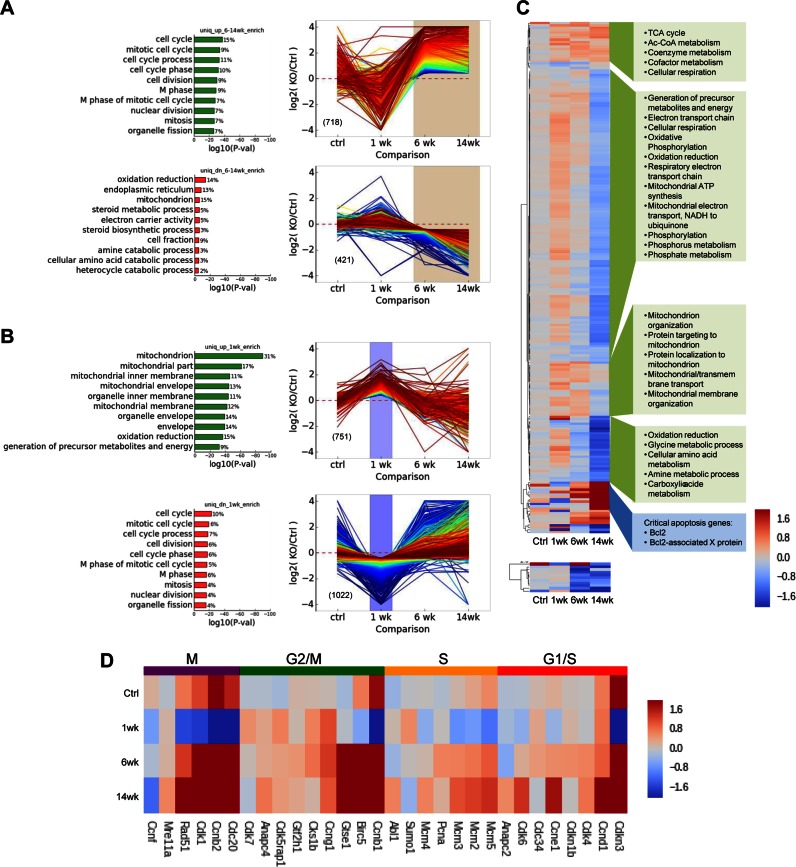
Figure 5.
Transcriptome analysis of RNaseH1 knockout in hepatocytes. Differential gene expression patterns and geneset enrichment analysis (A) Expression of transcripts uniquely enriched or depleted after 1 week tamoxifen induction in iKO hepatocytes relative to inducible control. (B) Transcripts uniquely enriched or depleted in 6 and 14 week cKO hepatocytes relative to constitutive 6 and 14 week controls respectively. The top 10 GO genesets (Biological Process) with minimum P value of 0.001 are shown (P values are adjusted for multiple hypothesis testing); percentage of differentially expressed genes within the specified class is given to the right of each bar. Gene expression profiles (Log2 fold change relative to appropriate control conditions) are colored by rank order. (C) Expression heatmap of genes encoded in the nucleus (upper) and the mitochondria (lower). Hierarchical clustering identified five major gene expression clusters among nuclear-encoded genes. Expression is shown as Log2 fold change relative to appropriate control condition. Enriched for GO Biological Processes are shown in green boxes (P < 0.005) or individual critical pathways (blue box). (D) Representative genes were selected for each of the indicated phases of the cell cycle and those for which we observed at least one knockout condition exhibiting significant differential expression are included. Expression is shown as Log2 fold change relative to appropriate control condition.

