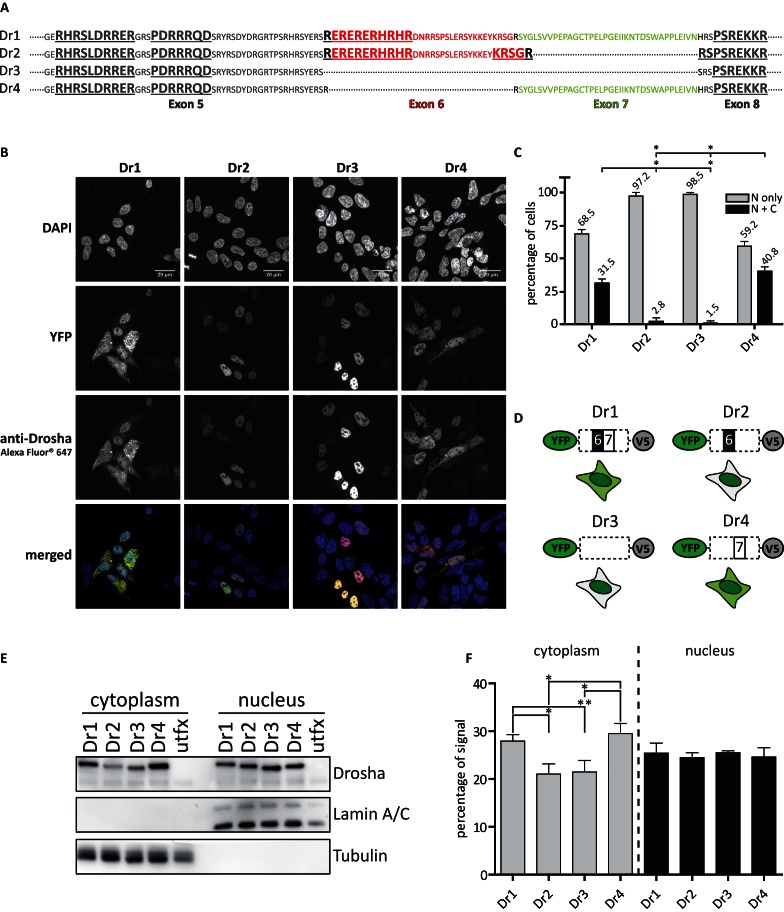
Figure 4.
Alternative splicing affects the localization of Drosha. (A) Sequence of the alternatively spliced region of Drosha. Bold and underlined sequences indicate predicted nuclear localization sequences (NLS). (B) Microscopic results of HEK293 cells transiently transfected with the respective YFP-tagged Drosha splice variants. Nuclei were stained with DAPI, Drosha was co-stained with a secondary antibody labeled with Alexa Fluor® 647. Images were acquired in 63× magnification. Scale bars represent 20 μM. (C) Quantitative analysis of immunofluorescence experiments performed on HEK293 cells transiently transfected with the respective Drosha splice variants on images acquired with 40× magnification. A number of at least 40 cells were counted per image. N: nucleus; C: cytoplasm. Statistical significance calculated with student's t-test: *P < 0.05; **P < 0.01; ***P < 0.001. N = 3. Error bars indicate SEM. (D) Schematic representation of YFP-tagged constructs of the Drosha splice variants and their detected cellular distribution in the cell. (E) Western blot results of the fractionation of cellular compartments from HEK293 cells transiently transfected with the respective YFP-tagged Drosha splice variants. (F) Quantitation of chemoluminescent signals derived from E. Percentages of signals were calculated for each splice variant based on the sum of signal volume from the respective cellular compartment. Statistical significance was calculated with student's t-test: *P < 0.05; **P < 0.01; ***P < 0.001. Error bars indicate SEM. N = 3.

