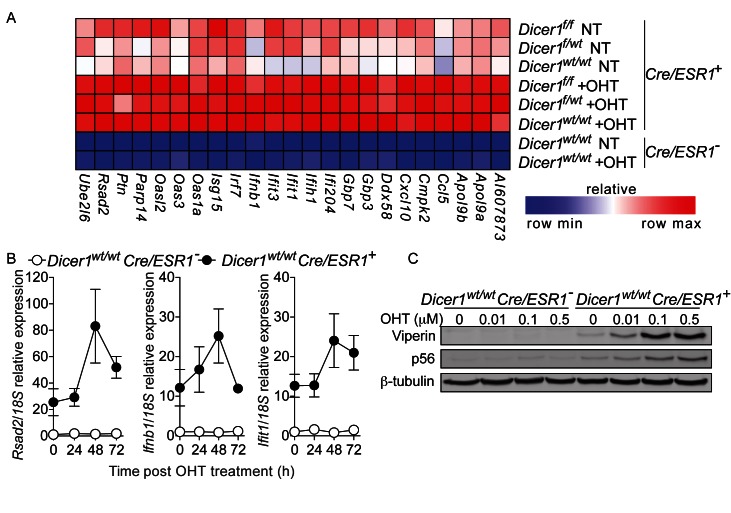
Figure 2.
Cre-ERT-dependent activation of type-I IFN gene signatures. (A) Microarray analysis of MEFs (48 h post-initial OHT treatment for Dicerwt/wt × Cre/ESR1+ and Cre/ESR1− cells and 96 h for Dicer f/wt × Cre/ESR1+and Dicer f/f cells), restricted to 23 ISGs. NT: non-treated. (B) RT-qPCR analysis of ISGs in MEFs after 24 h OHT treatment. Data are shown relative to non-treated Cre/ESR1− cells (data are presented as mean of three independent experiments in biological duplicate ± s.e.m.). (C) Dose-response study of varying concentrations of OHT on MEFs, on the levels of Viperin and p56, 72 h after stimulation. (B and C) Data shown are representative of three independent experiments.

