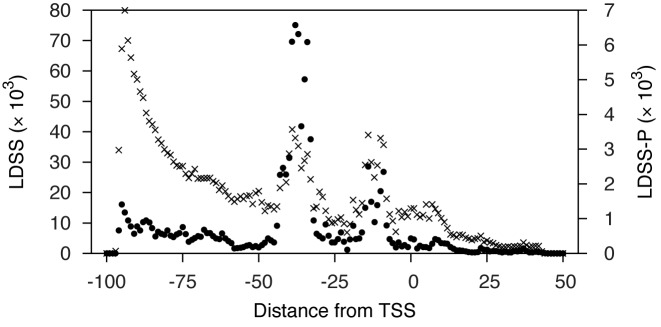
Figure 1.
Distribution of localized motif peak positions. Values along the vertical axis represent cumulative occurrence of LDSS (×) and LDSS-P (•) positive pentamer and hexamer peaks at each position along the horizontal axis. The criteria to identify localized motif (by LDSS) and co-expressed (LDSS-P) peaks are described in the text. Localized motifs identified by LDSS and LDSS-P positive peaks lay in specific regions: for LDSS, peaks tended to occur at around −95, −40, −15, and +4 from TSS; for LDSS-P, peaks typically occurred at around −40 and −15.

