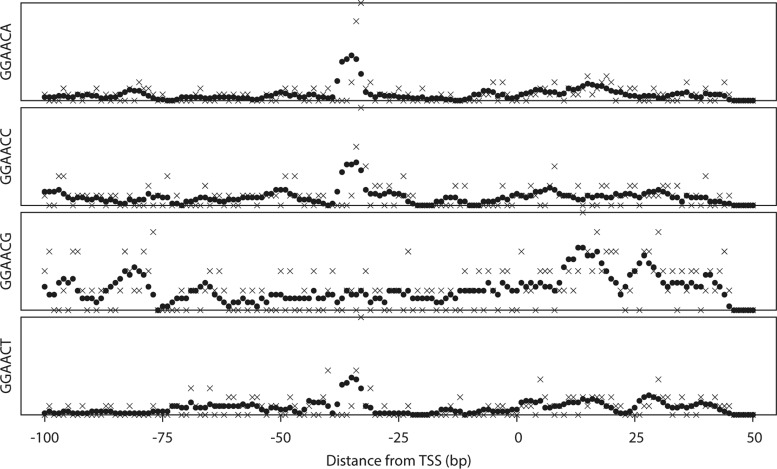
Figure 2.
Distribution profiles of GGAACN, RpoE2 target consensus motifs. Examples of hexamer analysis for GGAACN, which partly overlaps with the RpoE2 consensus motif. The vertical axis indicates the total number of promoters with the motif. The horizontal axis indicates relative position from the transcription start site (position at 0 corresponds to the TSS). Crosses (×) and filled circles (•) indicate raw count and running average, respectively, within a 5 bp window.

