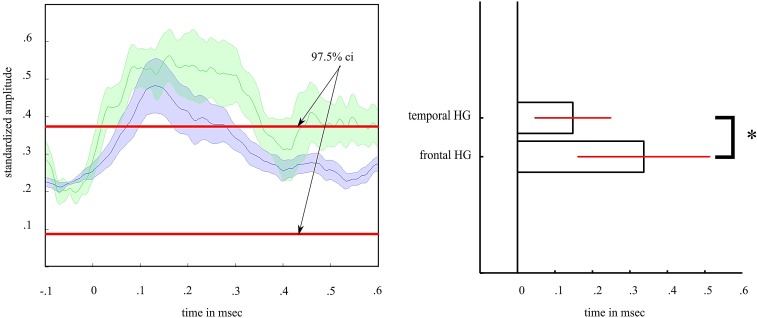
Fig. S2.
Comparison of amplitude modulation time over baseline. (Left) Depiction of standardized amplitude modulation to unpredictable deviants of the Hγ (HG) band in the frontal (green) and temporal (blue) ROIs. We standardized the amplitude to (i) correct for differences in modulation and (ii) estimate the CI of a joint baseline distribution (red lines). (Right) Frontal Hγ amplitude was longer activated over baseline (>97.5%) than temporal Hγ amplitude.

