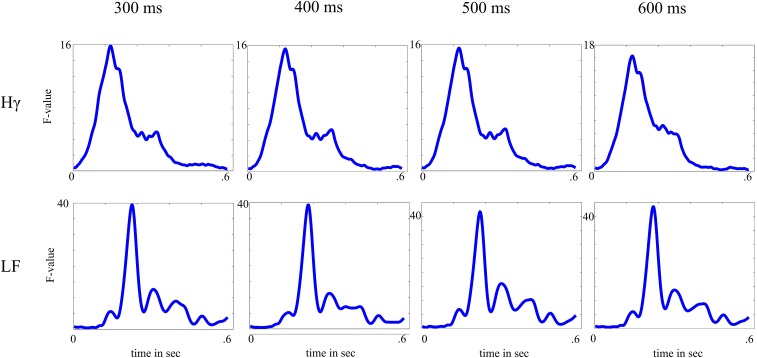
Fig. S4.
Depiction of F-value time series averaged across stimulus-responsive channels as a function of length of activation period. Amplitude modulation of Hγ and low-frequency (LF) activity of 300–500 ms after stimulus onset was compared with baseline activity (−100–0 ms). Selected principal components estimated within the set of stimulus-responsive channels in each interval are similar.

