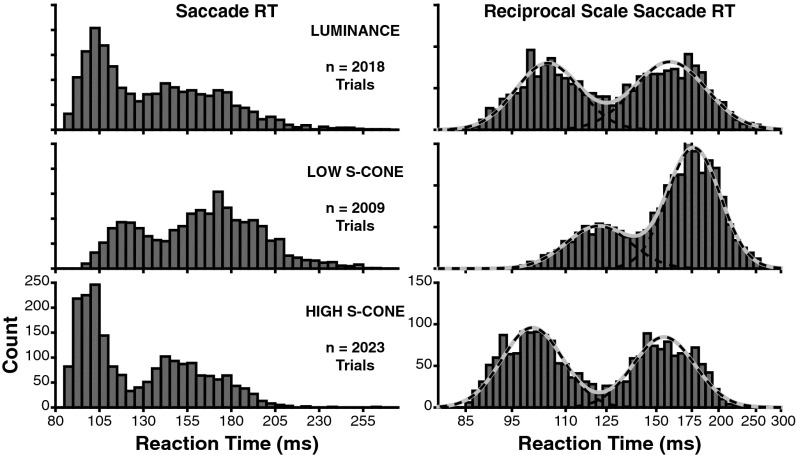
Fig. 2.
Saccadic RT distributions during the gap task to the three target types. Distributions include data pooled across both monkeys, and both spatial locations (in receptive field and mirrored), for each target type. (Left) Raw RT distributions in 5-ms bins. (Right) Same RT data on a reciprocal time scale, which creates a normal distribution. Data are shown in 50 bins evenly spaced on a reciprocal scale. Solid gray curves show the best fit of a Gaussian mixture model. Dashed black lines show the fit of each individual component of the Gaussian mixture. Gaussian fits were rescaled to overlay the raw histograms for visualization purposes.

