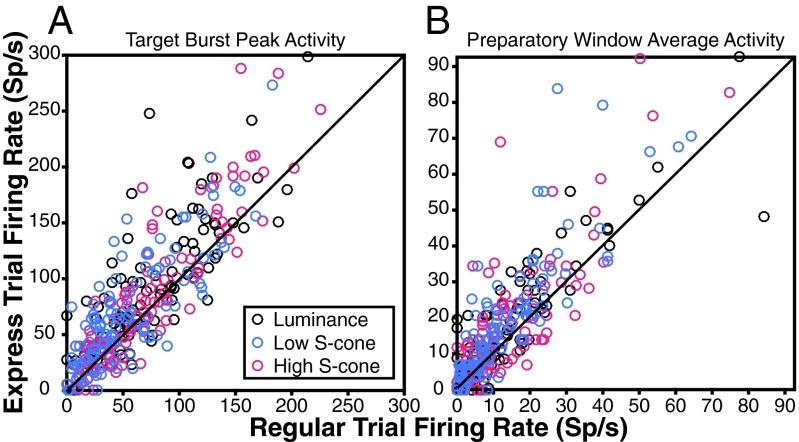
Fig. 4.
Individual neuron activity differences between express and regular saccade trials to each target type. Points above the unity line indicate neurons with greater response during express saccade trials for either the initial activity burst peak (A) or average preparatory window activity (B) (n = 104 luminance, 116 high S-cone, and 110 low S-cone neurons). Sp/s, spikes per second.

