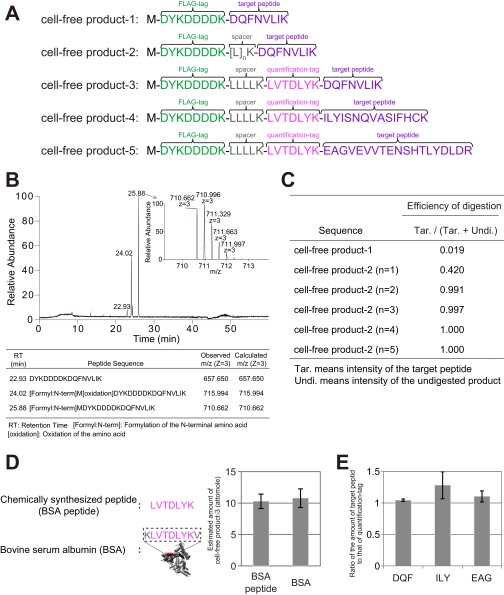
Fig. S1.
Examination and validation of the MS-QBiC workflow. (A) Amino acid sequences of test peptides used for the examination and validation of the MS-QBiC workflow. (B) LC-MS analysis of the synthesized cell-free product-1. A base peak chromatogram of the purified peptide and a mass spectrum of the ion peak with highest intensity (Inset) are shown. The table indicates three identified peptides that correspond to the three ion peaks in the chromatogram. (C) Effect of spacer sequence on the tryptic digestion efficiency. Digestion efficiency was calculated as the ion peak intensities of the digested peptide divided by the sum of those of the digested and undigested peptide. (D) Measuring the abundance of the quantification tag. Stable isotope-labeled cell-free product-3 was mixed with chemically synthesized LVTDLYK peptide (BSA peptide) or the tryptic digests of commercially available BSA. Concentration of the quantification tag was determined by comparing ion peak intensities of the stable isotope-labeled quantification tag with nonlabeled peptides. (E) Validation of the quantification of a target peptide. Stable isotope-labeled cell-free product-3, -4, and -5 were mixed with the chemically synthesized target peptides DQFNVLIK (DQF), ILYISNQVASIFHCK (ILY), and EAGVEVVTENSHTLYDLDR (EAG), respectively. Concentration of the target peptide was determined by comparing ion peak intensities of the stable isotope-labeled target peptide with nonlabeled peptides.

