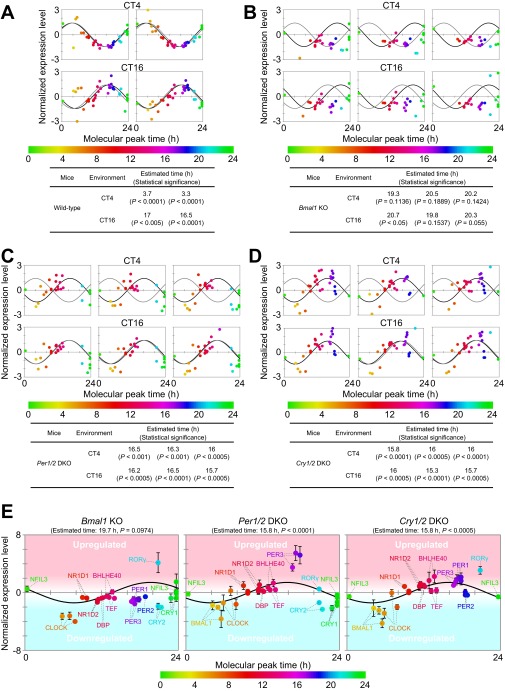
Fig. S8.
BT detection of wild-type and clock mutant mice by molecular timetable methods using a single-time-point data set. BT of (A) wild-type, (B) Bmal1 KO, (C) Per1/2 DKO, and (D) Cry1/2 DKO mice at CT4 and CT16 was estimated using datasets of expression profiles of peptides. Data sets were obtained with two (wild-type) and three (mutant) biological replicates. Best-fit cosine curves (black) and those based on the actual circadian time point (gray) are shown. The peak time of the best-fit curves indicates the estimated BT, which is also shown with its statistical significance. Statistical significance was obtained by estimating the goodness of the Pearson correlation in the cosine curve fitting of the experimental profile by comparing with those of 10,000 random profiles (details are described in SI Materials and Methods). The colors, in ascending order from green to red to blue, represent the molecular peak time, which corresponds to the molecular timetable of each peptide. The color code is represented below the diagrams. CT was defined as “extrapolated entrained time of mice in a LD cycle before sampling.” (E) Averaged expression profiles of peptides in Bmal1 KO, Per1/2 DKO, and Cry1/2 DKO mice at both CT4 and CT16 [normalized expression levels at CT4 (n = 3) and CT16 (n = 3) are averaged]. Error bars indicate SDs. Parental proteins of each peptide are designated.

