Fig. 3.
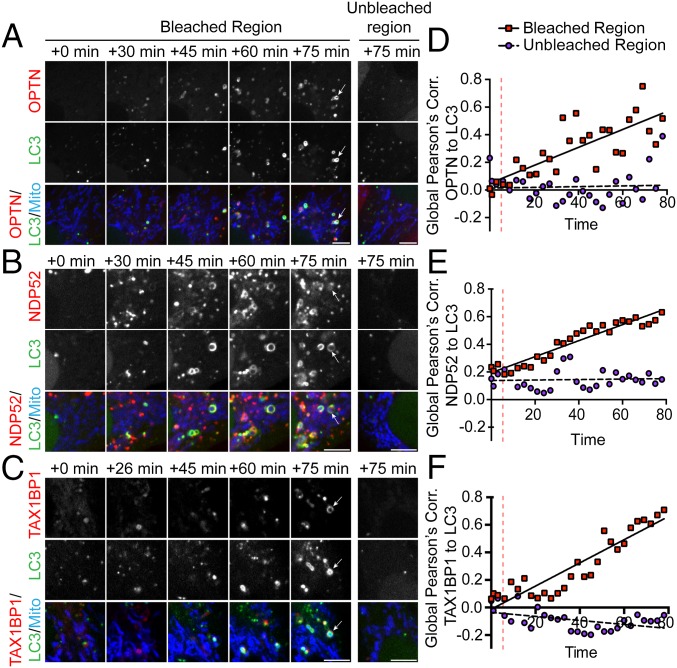
Autophagy receptor recruitment kinetics. (A–C) Confocal time series showing recruitment of autophagy receptors and LC3 to damaged mitochondria after MitoKR activation. OPTN (A), NDP52 (B), and TAX1BP1 (C) begin to accumulate on damaged mitochondria within 30 min. By 45 min, LC3 rings can be visualized forming on receptor-positive mitochondria. At 75 min post-MitoKR, there is significant colocalization of each autophagy receptor with LC3 in the bleached region, but not in distal unbleached regions. (D–F) Global Pearson’s correlation (Corr.) of each receptor to LC3 increases over time within the bleach window, but not in unbleached regions. (Scale bars: A–C, 5 μm.) Vertical dashed lines indicate bleach.

