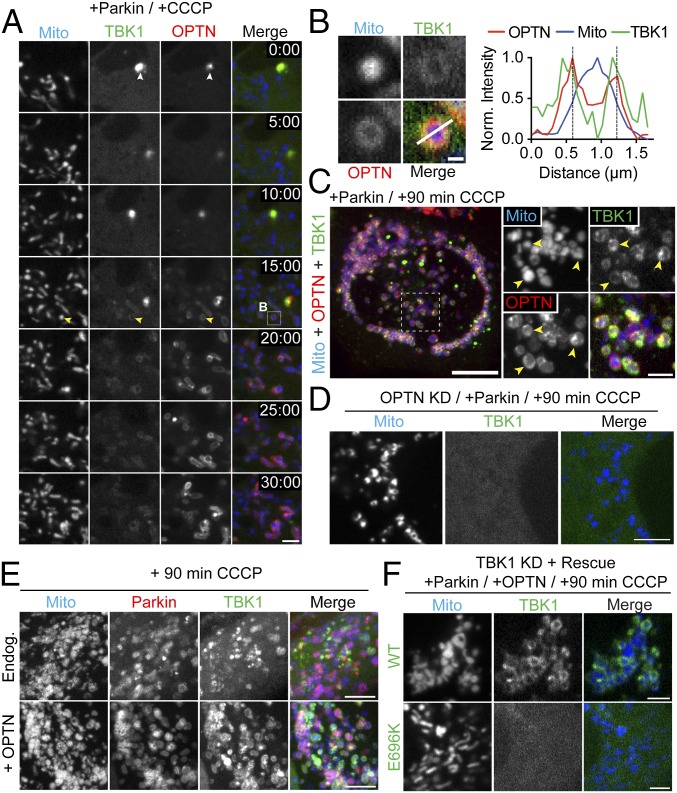
Fig. 6.
TBK1 is corecruited with OPTN to depolarized mitochondria. (A) Time series tracking recruitment of SNAP-TBK1 (green) and GFP-OPTN (red) to depolarized mitochondria in a Parkin-expressing cell. The time stamp indicates elapsed time since addition of CCCP (minutes:seconds). Immediately after CCCP treatment, OPTN and TBK1 are largely cytosolic but colocalize in small puncta (white arrowheads). At 15 min post-CCCP, both OPTN and TBK1 begin to appear on fragmented mitochondria (yellow arrowheads). (B) Magnified view of boxed region in A with corresponding line scan indicating TBK1/OPTN colocalization on an individual mitochondrion. Norm., normalized. (C) Confocal z-stack showing recruitment of OPTN and TBK1 to fragmented mitochondria (yellow arrowheads) 90 min post-CCCP treatment. (D) Depletion of OPTN eliminates TBK1 recruitment to depolarized mitochondria. (E) Overexpression of OPTN enhances TBK1 recruitment to Parkin-positive mitochondria at 90 min post-CCCP. Endog., endogenous. (F) Endogenous TBK1 was depleted and rescued with either WT-TBK1 (Top) or an ALS-linked TBK1 mutant unable to bind OPTN (E696K, Bottom). WT-TBK1 was clearly enriched on fragmented mitochondria after CCCP treatment, whereas TBK1-E696K remained cytosolic. [Scale bars: C (full size), 10 μm; A, D, and E, 5 μm; F and C (zoom), 2.5 μm; B, 0.5 μm.]

