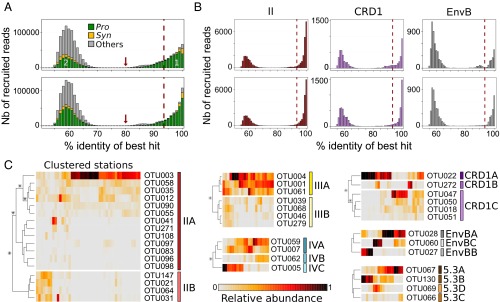
Fig. 2.
Percent identity of Tara Oceans petB-mitags versus sequences of the reference database and abundance at different stations along the transect of OTUs clustered into ESTUs. (A) Distribution of the percent identity of best hits of all petB candidate reads recruited from the Tara Oceans bacterial-size fraction metagenomes against the petB reference database. Populations 1 and 2 correspond, respectively, to genuine petB reads and to nonspecific signal, due either to petB reads from organisms not included in the reference database or to petB-related genes. The gray part in population 1 corresponds to petB reads attributable to photosynthetic organisms of the reference database other than Prochlorococcus and Synechococcus. The red arrow shows the 80% cutoff used to separate the petB signal from noise. The Top and Bottom panels correspond to recruitments made before and after addition of the 136 newly assembled environmental petB sequences, respectively. (B) Same as A but for some selected Synechococcus taxa (see Fig. S2 for all other picocyanobacterial taxa). (C) Determination of ESTUs based on the distribution patterns of within-clade 94% OTUs. At each station, the number of reads assigned to a given OTU is normalized by the total number of reads assigned to the clade in this station. Stations and OTUs are filtered based on the number of reads recruited and hierarchically clustered (Bray–Curtis distance) according to distribution pattern. Only Synechococcus clades split into different ESTUs are shown (see Fig. S4 for Prochlorococcus). Stars indicate nodes supported by a P value < 0.05 as determined using similarity profile analysis (SIMPROF; test not applicable to pair comparisons).

