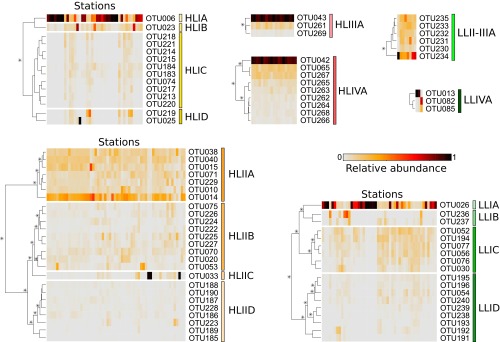
Fig. S4.
Prochlorococcus ESTUs based on the distribution patterns of within-clade 94% OTUs. At each station, the number of reads assigned to a given OTU is normalized by the total number of reads assigned to the clade in this station. Stations and OTUs are filtered based on the number of reads recruited. OTUs are hierarchically clustered (Bray–Curtis distance) according to their distribution pattern. Stars indicate nodes supported by a P value < 0.05 as determined using similarity profile analysis (SIMPROF; test not applicable to pair comparisons).

