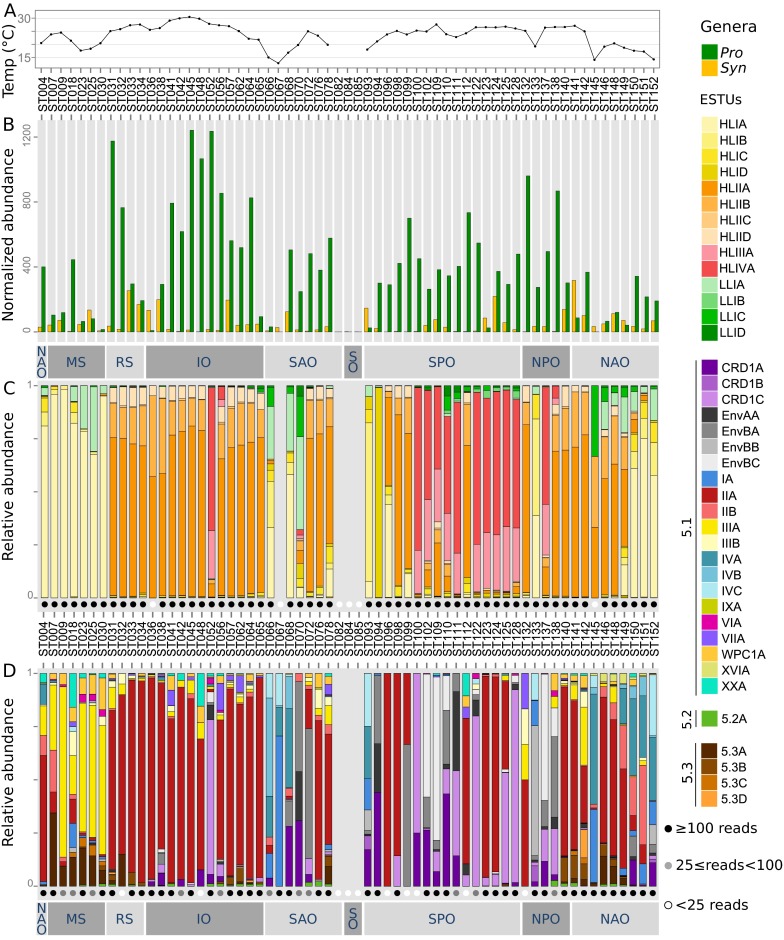
Fig. S5.
Marine picocyanobacteria community structure in Tara Oceans surface metagenomes based on petB-miTags recruitments. (A) Surface water temperature along the Tara Oceans transect. (B) Relative abundances of Prochlorococcus and Synechococcus normalized to the total number of reads at each station. (C and D) Relative abundances of Prochlorococcus and Synechococcus ESTUs, respectively. White, gray, and black dots indicate the number of reads used to build the profile, as detailed in the Inset. For readability, temperature for stations TARA_082 (7.3 °C), TARA_084 (1.8 °C), and TARA_085 (0.7 °C) are not shown on A. Abbreviations: IO, Indian Ocean; MS, Mediterranean Sea; NAO, North Atlantic Ocean; NPO, North Pacific Ocean; RS, Red Sea; SAO, South Atlantic Ocean; SO, Southern Ocean.

