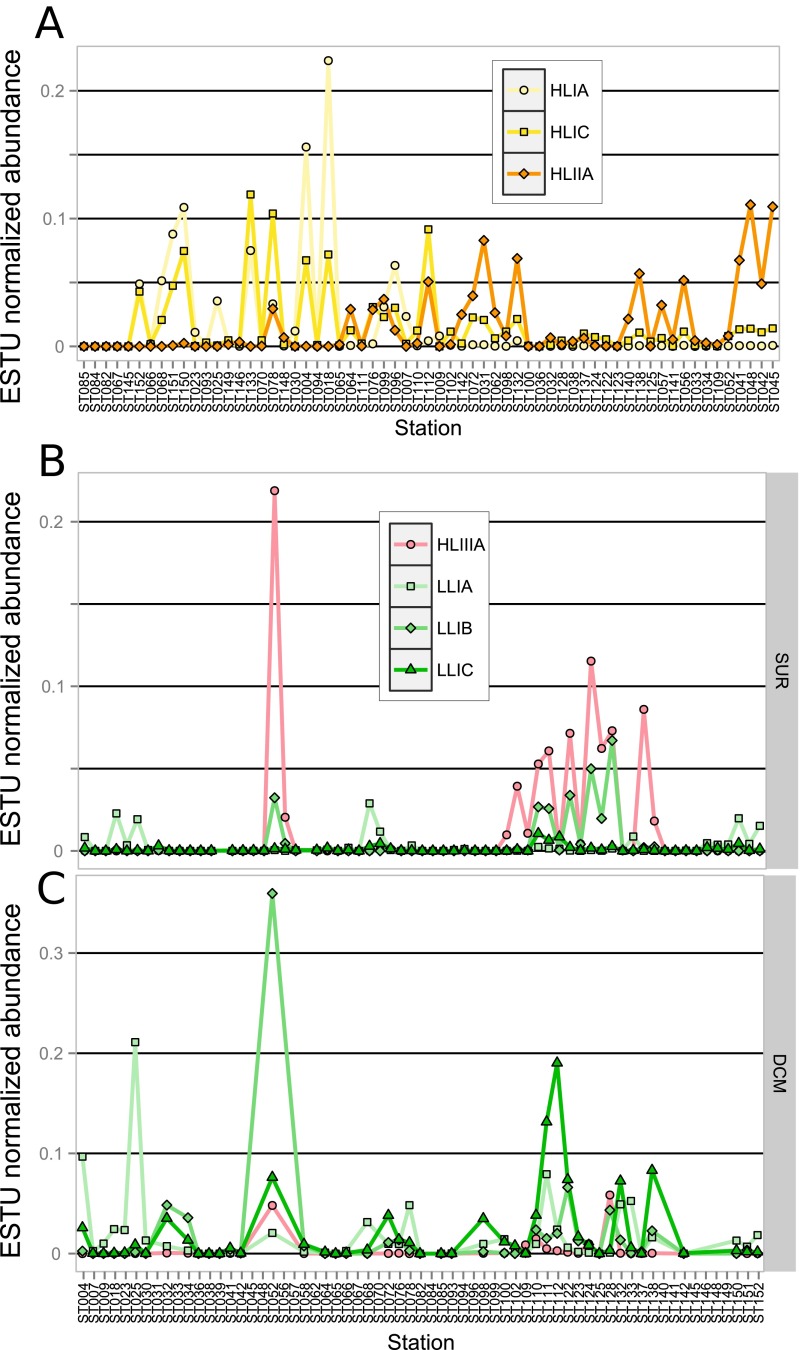
Fig. S7.
Distribution of minor Prochlorococcus ESTUs with regard to major ESTUs in the Tara Oceans metagenomes. Relative abundance normalized to the total number of reads per ESTU of (A) ESTUs HLIA and HLIC with regard to HLIIA in surface waters and (B and C) ESTUs LLIA–C with regard to HLIIIA in surface waters and the DCM, respectively. For A, stations were sorted from the lowest to highest temperatures and for B by sampling date.

