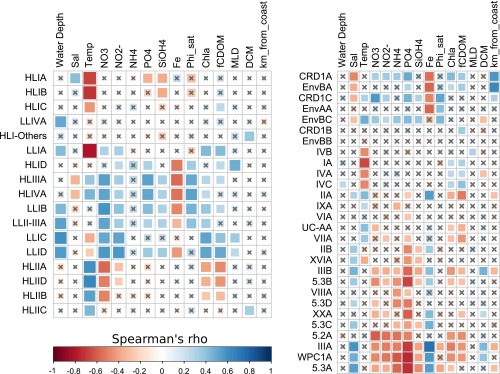
Fig. S8.
Correlation analysis between marine picocyanobacterial ESTUs and environmental parameters measured along the Tara Oceans transect for all sampled depths. (A) Prochlorococcus ESTUs. (B) Synechococcus ESTUs. The scale shows the degree of correlation (blue) or anticorrelation (red) between the two sets of data. Correlations with an adjusted P value > 0.05 are indicated by gray crosses. Abbreviations: DCM, deep chlorophyll maximum; fCDOM, fluorescence, colored dissolved organic matter; MLD, mixed layer depth; Sal, salinity; Temp, temperature; Φsat, satellite-based NPQ-corrected quantum yield of fluorescence.

