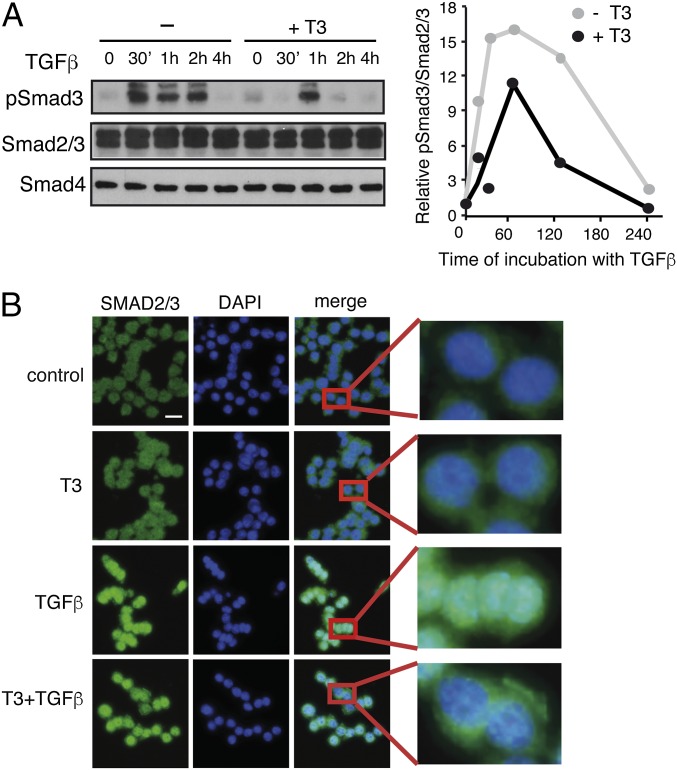
Fig. 4.
Effect of T3 on SMAD phosphorylation and translocation. (A) Western blot analysis of GH4C1 cell extracts with phospho-SMAD3 (pSMAD3) and total SMAD2/3 and SMAD4 antibodies after treatment with T3 for 36 h and with TGF-β for the indicated periods. (Right) Quantification of the pSMAD3/SMAD2,3 ratio from two independent experiments. Data are expressed as fold-induction over the values obtained at time 0 in the untreated cells. (B) The cells were incubated with T3 for 36 h and/or TGF-β during 60 min, fixed, and analyzed by indirect immunofluorescence with SMAD2/3 antibody. Representative images of SMAD2/3, DAPI staining of nuclei, and merge images are shown. (Right) Detail of the indicated areas. (Scale bar, 50 µm.)

