Fig. 10.
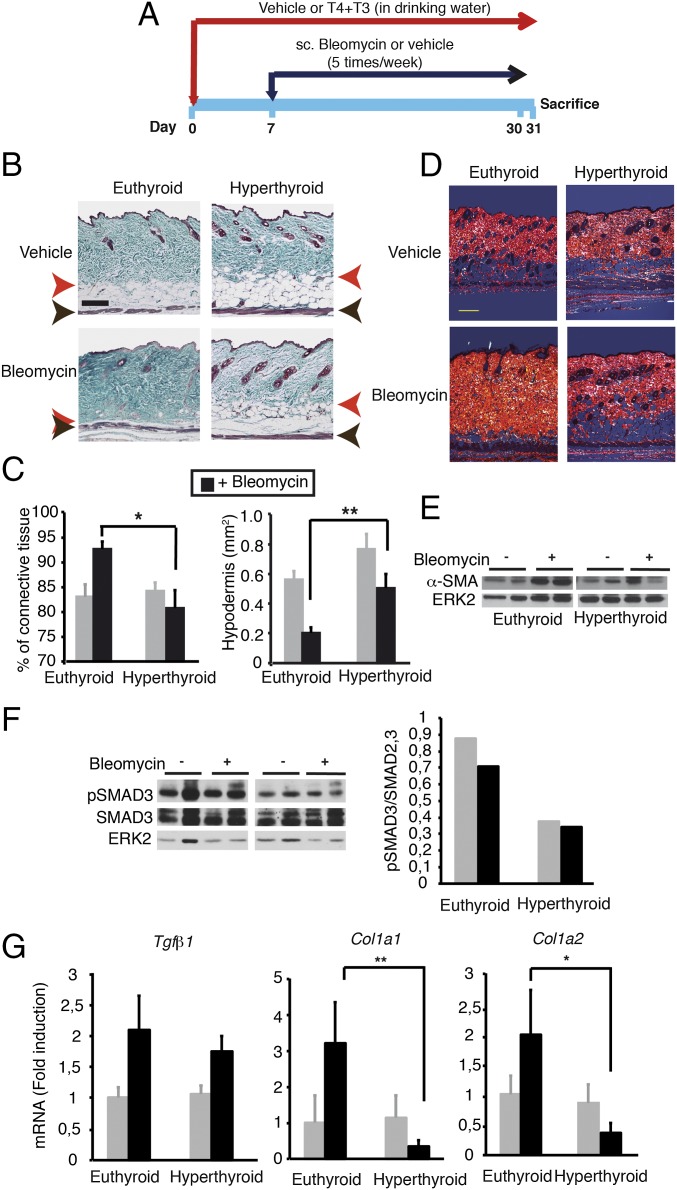
Thyroid hormone treatment alleviates skin fibrosis induced by bleomycin administration. (A) Scheme of the experimental model (n = 6). (B) Masson’s trichrome staining of skins. The red arrow shows the junction of the dermis with the s.c. fat layer (hypodermis), and the black arrow marks the muscle. (Scale bar, 200 µm.) (C) The percentage of the dermal connective tissue and the area of the hypodermis were calculated from the stained slides (mean ± SEM). ANOVA differences using the Bonferroni post hoc test between vehicle and bleomycin-treated mice are indicated. (D) Representative Picrosirius red stained slides of the skin of the different experimental groups observed under polarized light to detect collagen. (Scale bar, 200 µm.) (E) Western blot of α-SMA from skins of the different groups. ERK2 was used as a loading control. (F) Western blot of pSMAD3, SMAD2/3, and ERK. (Right) Ratio pSMAD3/total SMAD in euthyroid and hyperthyroid animals. (G) Transcript levels of profibrotic genes (mean ± SEM) in the skin of the different groups. Statistically significant ANOVA differences between euthyroid and hyperthyroid mice treated with bleomycin are shown.

