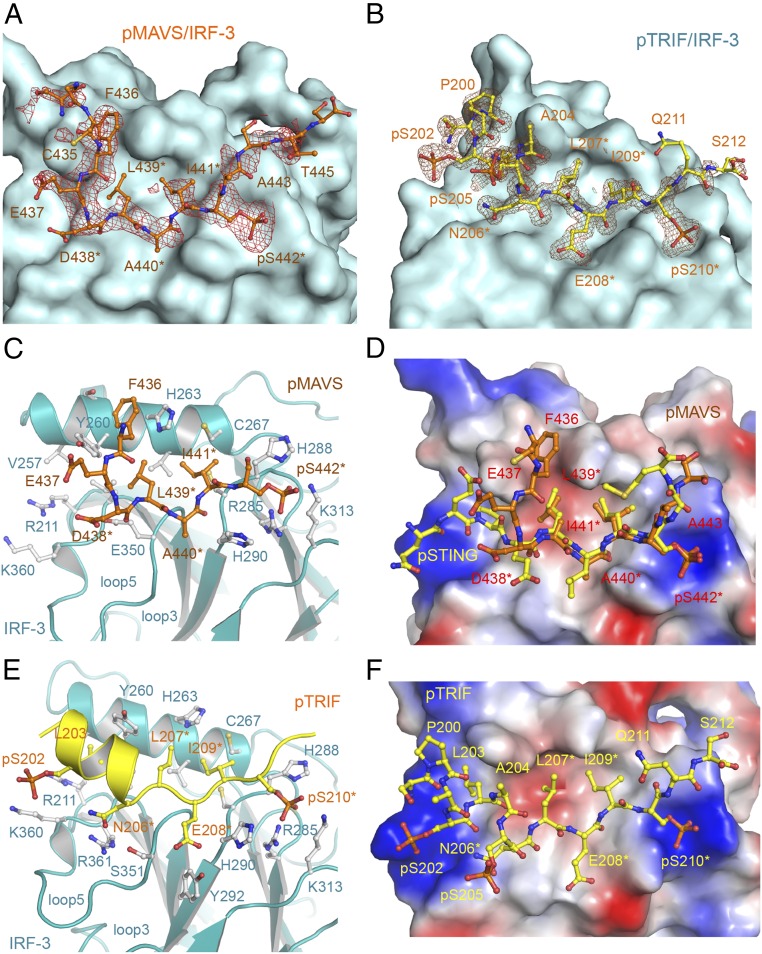
Fig. 2.
Structures of pMAVS and pTRIF peptides bound to IRF-3. (A) Difference map showing pMAVS bound to IRF-3 contoured at 2.5σ. The σA-weighted Fo-Fc map was calculated with pMAVS omitted from the model. pMAVS is shown by the orange ball-and-stick model, and IRF-3 is shown by the cyan surface. Residues of the pLxIS motif are indicated by asterisks. (B) Difference map showing pTRIF bound to IRF-3 contoured at 2.5σ. The σA-weighted Fo-Fc map was calculated with pTRIF omitted from the model. pTRIF is shown by the yellow ball-and-stick model, and IRF-3 is shown by the cyan surface. (C) Interactions between pMAVS and IRF-3. pMAVS is shown by the orange ball-and-stick model. IRF-3 is shown by cyan ribbons. Residues of IRF-3 involved in pMAVS binding are shown by gray ball-and-stick models. Residues of the pLxIS motif are indicated by asterisks. (D) Superposition of the structures of pMAVS and pSTING bound to IRF-3. pSTING is shown by the yellow ball-and-stick model. IRF-3 is shown by the surface representation colored according to surface electrostatic potential. The positively charged surface is in blue, and the negatively charged surface is in red. (E) Interactions between pTRIF and IRF-3. pTRIF is shown by the yellow ribbon with key residues in ball-and-stick models. IRF-3 is shown by cyan ribbons with residues involved in pTRIF binding shown by gray ball-and-stick models. (F) Structure of pTRIF bound to IRF-3. The ligand-binding surface of IRF-3 is colored according to surface electrostatic potential as in D. pTRIF is shown by the yellow ball-and-stick model.

