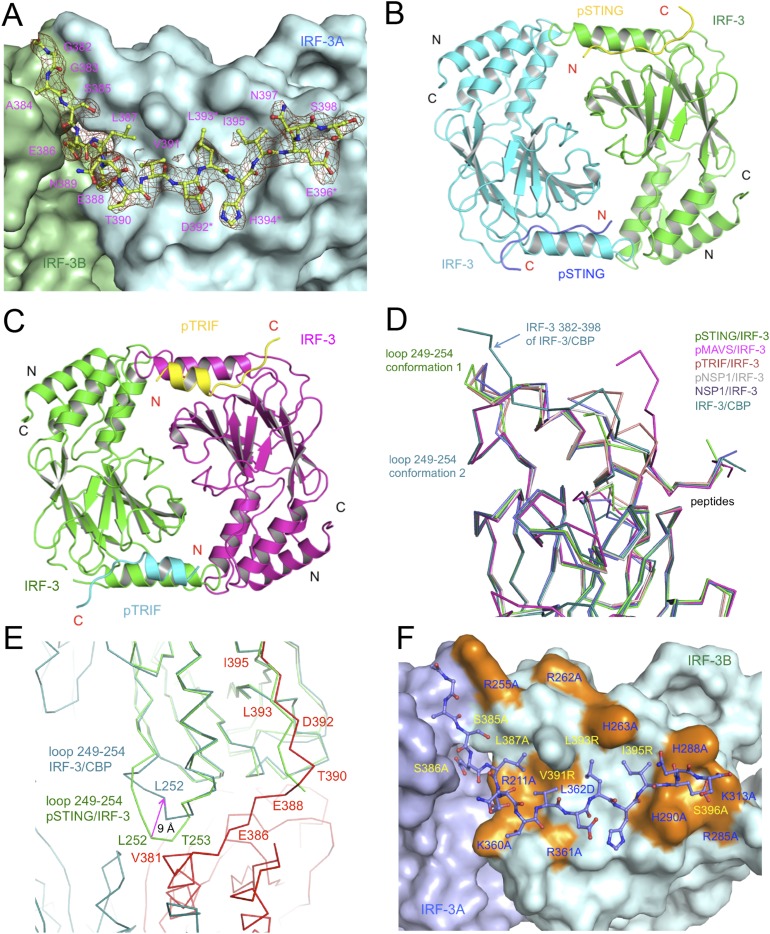
Fig. S5.
Structure of the IRF-3/CBP complex, crystallographic dimers of IRF-3 bound to pSTING and pTRIF, and comparison of IRF-3 structures. (A) Difference map showing the CTT (residues 382–398) of IRF-3 in the IRF-3/CBP complex contoured at 2.5σ. The σA-weighted Fo-Fc map was calculated with these residues omitted from the model. The omitted residues are shown by the light green ball-and-stick models, and the rest of the model is shown by the green and cyan surface. Residues of the pLxIS motif are indicated by asterisks. (B) Structure of the pSTING/IRF-3 dimer in the crystallographic asymmetric unit. (C) Structure of the crystallographic symmetry-related pTRIF/IRF-3 dimer. (D) Superposition of IRF-3 structures from the pSTING/IRF-3, pMAVS/IRF-3, pTRIF/IRF-3, pNSP1/IRF-3, NSP1/IRF-3, and IRF-3/CBP complexes. (E) Superposition of IRF-3 structures from the IRF-3/CBP complex (cyan and red) and the pSTING/IRF-3 complex (green). The conformational change in loop 249–254 is indicated by the magenta arrow. (F) Mutations of IRF-3 affecting its dimerization and activation mapped onto the structure of the IRF-3/CBP complex. Mutations of residues at the IRF-3 CTT binding surface are highlighted in orange and are labeled in blue. Mutations of IRF-3 C-terminal residues (purple ball-and-stick models) are labeled in yellow.

