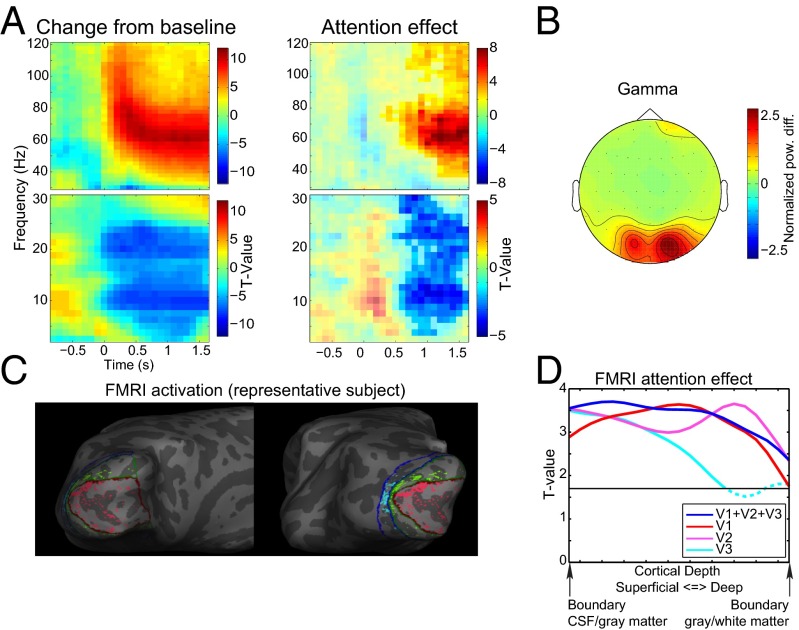
Fig. 2.
Task-related EEG and fMRI effects. (A) Time-frequency representations of power relative to a pretrial baseline collapsed over the two attention conditions and as a contrast between the attention-on and attention-off conditions. Only trials with 1600-ms visual stimulation without a speed change were used for this representation. Separate time-frequency representations are shown for low (2.5–30Hz) and high (30-120 Hz) frequencies. (B) Average topography over subjects of the change in the γ-band from baseline. For each subject, the average power change from baseline in the range from 55 to 85 Hz during the visual stimulation period was computed and subsequently root-mean-square normalized over channels before averaging. (C) The 10% strongest activated vertices within the left hemisphere for V1 (red), V2 (green), and V3 (blue) for a representative subject. (D) Laminar-specific attention effect for the selected voxels over all subjects for V1, V2, and V3 combined, and separately.

