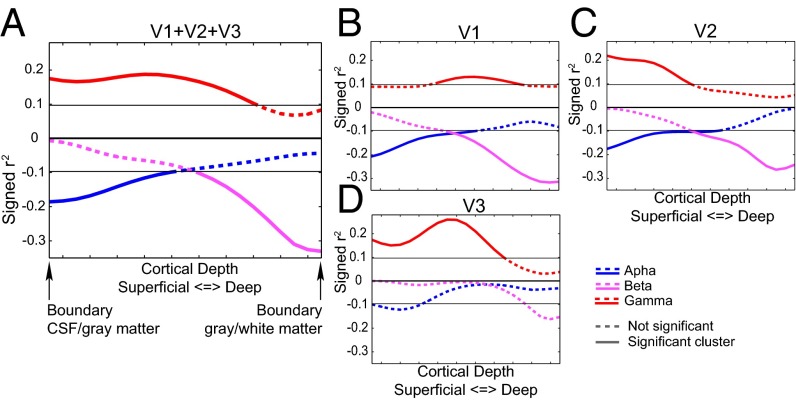
Fig. 4.
Correlation of the attention effects in EEG power with the laminar-resolved attention effects in fMRI. The results for V1, V2, and, V3 both combined (A) and separately (B–D) are shown. The signed r2 values plotted on the y axis are computed by multiplying the squared correlation with the sign of the correlation. Clusters significant after correcting for multiple comparisons (P < 0.05) are indicated with a solid line.

