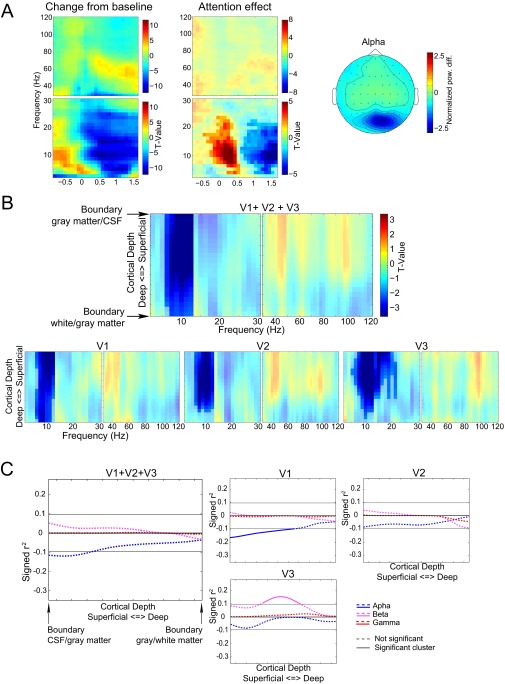
Fig. S3.
Results for EEG and the laminar-specific EEG–BOLD relation after low frequency-based ICA denoising of the EEG data. (A) Frequency-specific changes in EEG power compared with baseline and as a result of the attention manipulation similar to A and B of Fig. 2. (B) Laminar- and frequency-resolved trial-by-trial relation between BOLD and EEG, similar to Fig3. (C) Laminar-specific correlation between the EEG and laminar-resolved fMRI, similar to Fig 4. In A and B, significant clusters (P < 0.05 corrected) are highlighted; in C, significant clusters are indicated with a solid line. To facilitate comparison, scaling is the same as in the main figures.

