Fig. 3.
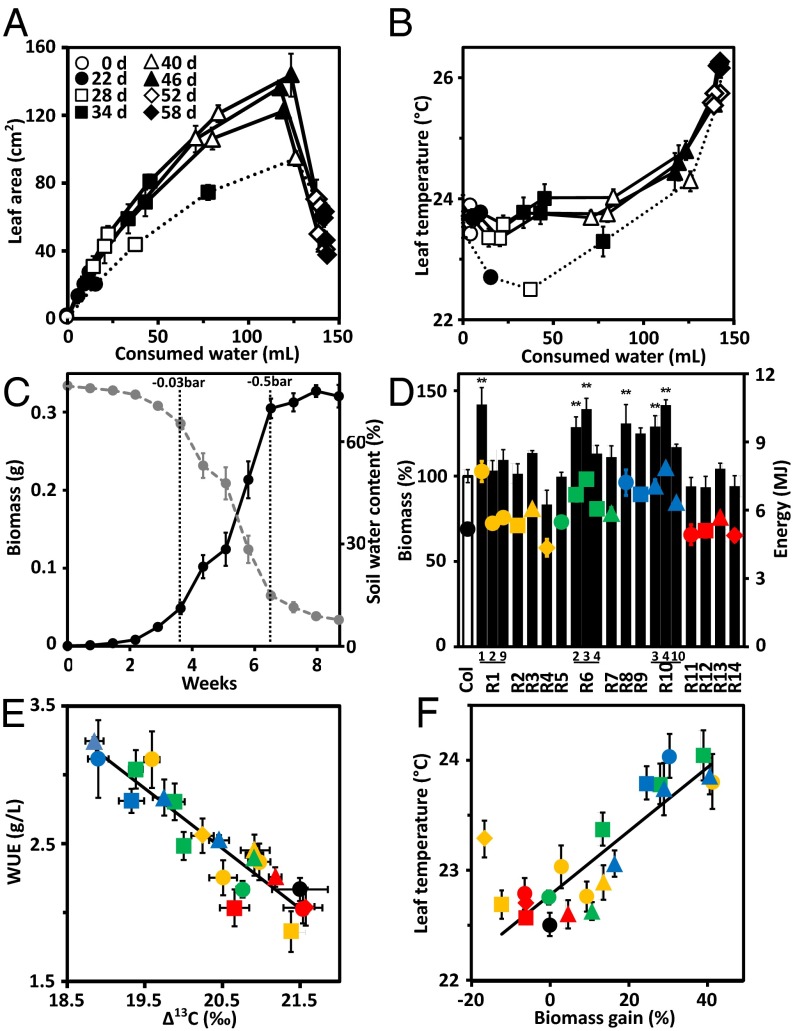
Efficient water use conferred by ABA receptor expression. Water consumption in relation to (A) growth and (B) leaf surface temperatures of three independent RCAR6-overexpressing lines (solid graphs) compared with Col-0 (dotted line) growing on drying soil. Single plantlets (n = 4 per line) were grown for 18 d before the discontinuation of watering at soil water potential Ψ = −0.02 bar. At the onset of drought (day 0) water consumption per plant was recorded for 58 consecutive days (58 d). Plants were grown under a short-day light regime (8 h, photon density of 150 μmol⋅m−2⋅s−1) to keep them at vegetative developmental stage. Growth is expressed as increase in leaf area of the projected rosette. Wilting of leaves caused a reduction in rosette size. (C) Accumulation of biomass (dry weight, n = 6) in Col-0 and changes in soil water content (gray line) during a drought experiment as shown in A as mean ± SEM. The dotted vertical lines indicate threshold Ψ values for mild and severe water deficit, respectively. (D) Above-ground biomass and calorimetric yield of RCAR1–RCAR14 lines (R1–R14) at the end of drought treatment as in A. Biomass of Col-0 was 0.31 ± 0.01 g dry weight per plantlet and set to 100% (column). The energy content of the plants at harvest is indicated by symbols; Col-0 (black filled circle), subclade I comprising members RCAR1–4 lines (yellow), subclade II with RCAR5–7 (green) and RCAR8–10 (blue), and subclade III with RCAR11–14 (red). (E) Association of 13C discrimination in bulk above-ground biomass with WUE (biomass produced per water consumed) as shown in D. (F) Association of biomass gain under drought with leaf surface temperatures of lines under well-watered conditions taken from 7-wk-old plants. Symbols in E and F are as in D. n = 4 biological replicates per data point, mean ± SEM, **P < 0.001 compared with wild type (one-way ANOVA).

