Fig. 4.
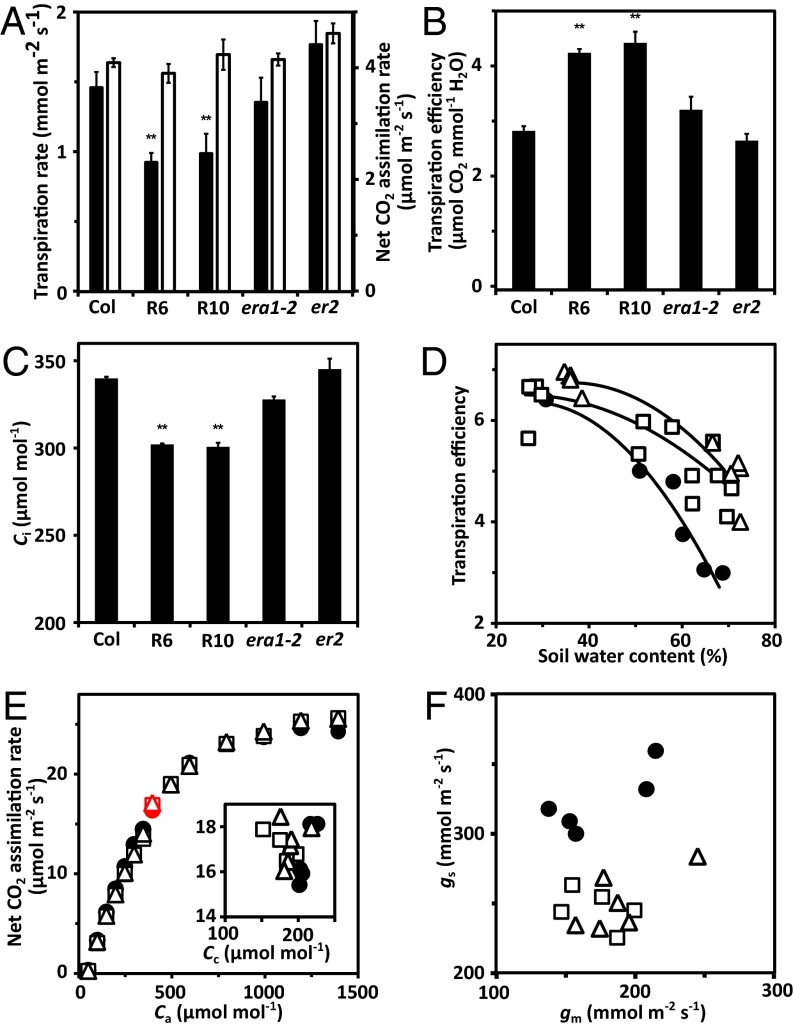
Reduced transpiration and maintenance of CO2 assimilation in RCAR6-3 and RCAR10-4 lines. Whole plant gas exchange analysis at well-watered conditions (A–C) and during drought (D). (A) Transpiration (black bars) and net CO2 assimilation rates (open bars) of RCAR6 (R6) and RCAR10 (R10) lines in comparison with Col-0 and gas exchange mutants era1-2 and er2 at water potential Ψ > −0.03 bar and external CO2 concentration Ca of 420 μmol⋅mol−1. (B) Transpiration efficiency, i.e., ratio of rates for net CO2 assimilation and transpiration (mmol CO2 mol H2O−1) and (C) intercellular CO2 concentration Ci of the same plants as in A. (D) Transpiration efficiency affected by soil water content in RCAR6 (open squares), RCAR10 (open triangles), and wild type (filled circles); single whole plant measurements with 10 technical replicates per data point (D), **P < 0.001 compared with wild type. (E) Analysis of net CO2 assimilation rates in response to external CO2 concentrations (Ca, ambient Ca in red) and (F) mesophyll (gm) and stomatal conductance (gs) in single leaves at high photosynthetic photon flux density (1,500 μmol⋅m−2⋅s−1) and soil Ψ > −0.03 bar. The CO2 concentration in chloroplasts (Cc; Inset) and conductance rates were analyzed at ambient Ca (400 μmol⋅mol−1). Labeling of plant lines is as in D. (E) n ≥ 5 with six technical replicates. (Inset and F) Data of single measurements.

