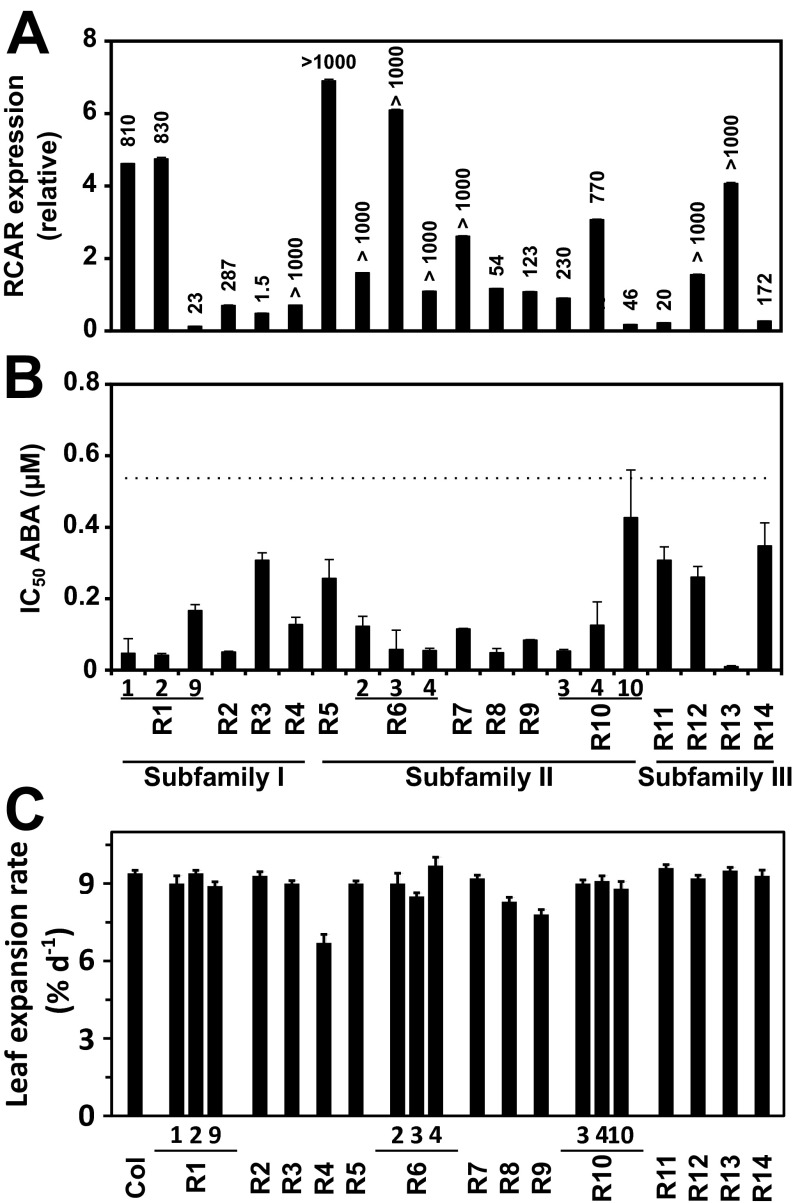
Fig. S1.
Analysis of Arabidopsis lines overexpressing individual ABA receptors. (A) Transcript abundance of the ectopically expressed ABA receptor shown relative to ubiqutin10 expression (columns; ±SD) and to the expression in wild type indicated on Top. The analysis was performed three times with different biological material and gave similar results. The data depict one experiment with three technical replicates. (B) Germination assay of Arabidopsis RCAR lines. The IC50 value for ABA is given for each line (3 × 30 seeds per line and ABA concentration, five different concentrations). The IC50 value for Columbia was 0.56 ± 0.13 μM ABA and is signified by the dotted line. Three independent experiments were conducted. (C) Maximum linear expansion rates of leaves for Col-0 and ABA receptor lines growing under well-watered conditions. The values are given in percentage of increase per day.

