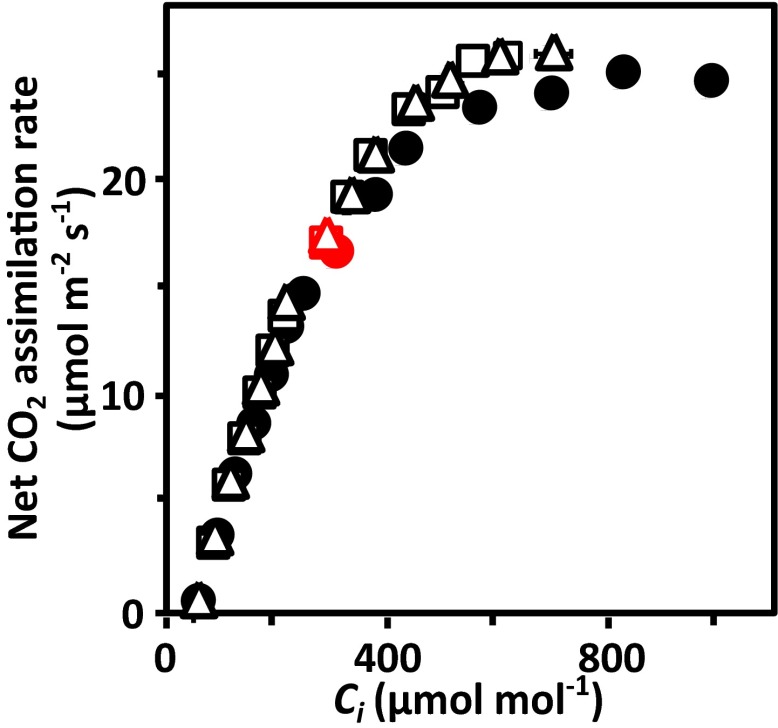
Fig. S5.
Net CO2 assimilation rates in response to intercellular CO2 concentrations, Ci. Single leaves of RCAR6-3 (open squares), RCAR10-4 (open triangles), wild type (filled circles) were measured at high photosynthetic photon flux density (1,500 μmol⋅m−2⋅s−1) and well-watered conditions (Ψ > −0.03 bar). The net CO2 assimilation rates at ambient CO2 concentration (400 μmol⋅mol−1) and the corresponding Ci value are highlighted in red (n ≥ 5 biological replicates per line, two technical replicates per data point, mean ± SEM).

