Significance
We demonstrate that, although the two phosphatases of the Calvin–Benson cycle of photosynthesis [sedoheptulose-1,7-bisphosphatase (SBPase) and fructose-1,6-bisphosphatase (FBPase)] share extensive structural homology, their redox-regulatory disulfides are incorporated in strikingly different positions, in agreement with an independent evolutionary origin of each enzyme. This article compares in detail the structures of the enzymes together with their regulatory and catalytic properties as well as their phylogenies. Significantly, the substrate binding site of SBPase is larger than that of FBPase, thus allowing it to accommodate both seven- and six-carbon sugar phosphate substrates, whereas FBPase is active only with the latter. The data suggest that SBPase is of archaeal origin, whereas FBPase is descended from bacteria.
Keywords: Calvin–Benson cycle; sedoheptulose-1,7-bisphosphatase; fructose-1,6-bisphosphatase; redox regulation; thiol–disulfide exchange
Abstract
The Calvin–Benson cycle of carbon dioxide fixation in chloroplasts is controlled by light-dependent redox reactions that target specific enzymes. Of the regulatory members of the cycle, our knowledge of sedoheptulose-1,7-bisphosphatase (SBPase) is particularly scanty, despite growing evidence for its importance and link to plant productivity. To help fill this gap, we have purified, crystallized, and characterized the recombinant form of the enzyme together with the better studied fructose-1,6-bisphosphatase (FBPase), in both cases from the moss Physcomitrella patens (Pp). Overall, the moss enzymes resembled their counterparts from seed plants, including oligomeric organization—PpSBPase is a dimer, and PpFBPase is a tetramer. The two phosphatases showed striking structural homology to each other, differing primarily in their solvent-exposed surface areas in a manner accounting for their specificity for seven-carbon (sedoheptulose) and six-carbon (fructose) sugar bisphosphate substrates. The two enzymes had a similar redox potential for their regulatory redox-active disulfides (−310 mV for PpSBPase vs. −290 mV for PpFBPase), requirement for Mg2+ and thioredoxin (TRX) specificity (TRX f > TRX m). Previously known to differ in the position and sequence of their regulatory cysteines, the enzymes unexpectedly showed unique evolutionary histories. The FBPase gene originated in bacteria in conjunction with the endosymbiotic event giving rise to mitochondria, whereas SBPase arose from an archaeal gene resident in the eukaryotic host. These findings raise the question of how enzymes with such different evolutionary origins achieved structural similarity and adapted to control by the same light-dependent photosynthetic mechanism—namely ferredoxin, ferredoxin-thioredoxin reductase, and thioredoxin.
In oxygenic photosynthesis, CO2 fixation takes place via the Calvin–Benson cycle consisting of 13 individual reactions that can be separated into carboxylation, reduction, and regeneration phases (1). Considerable effort has focused on a description of the individual enzymes and the overall regulation of the cycle (2, 3). In chloroplasts, the activity of four enzymes of the cycle is linked to light: NADP-glyceraldehyde 3-phosphate dehydrogenase, phosphoribulokinase, fructose-1,6-bisphosphatase (FBPase), and sedoheptulose-1,7-bisphosphatase (SBPase). In some plants, Rubisco is similarly regulated indirectly by Rubisco activase. The activity of each of these enzymes is modulated by the ferredoxin/thioredoxin system —a thiol-based mechanism in which photoreduced ferredoxin provides electrons for the reduction of thioredoxin (TRX) by the enzyme ferredoxin-thioredoxin reductase (FTR) (3–5). TRX, in turn, reduces specific disulfides and thereby activates the regulatory members by thiol–disulfide exchange. Chloroplasts contain several typical thioredoxin subtypes (f, m, x, y, and z) with different target preferences (6) as well as a number of proteins containing an atypical TRX active site (7). The ferredoxin/thioredoxin system was uncovered by observing the activation of FBPase by photoreduced ferredoxin (8)—a finding later extended to SBPase (9). Due to its high activity and convenient assay, FBPase was used to explore the system, eventually leading to the identification of FTR and TRX as essential components and to the finding that other photosynthetic enzymes are regulated by this mechanism (10–12). As part of this study, SBPase, which at the time was considered to be a secondary activity event of FBPases (e.g., 13, 14), was found to be a separate enzyme in chloroplasts (15). Both phosphatases function in the regeneration stage of the Calvin–Benson cycle. Their natural substrates fructose-1,6-bisphosphate (FBP) and sedoheptulose-1,7-bisphosphate (SBP) show high structural similarity, the main difference being that SBP possesses one additional C(H2O) group compared with FBP (seven vs. six carbon atoms, respectively). As a result of this history, we have gained an understanding of the structure and regulation of FBPase (16, 17). Subsequent work has also increased our understanding of NADP-glyceraldehyde 3-phosphate dehydrogenase, phosphoribulokinase, and Rubisco activase (5). By contrast, our knowledge of SBPase is limited, primarily due to the difficulty in obtaining stable preparations of the enzyme (15, 18). The work that was accomplished demonstrated that SBPase has unique TRX-linked disulfides and is a bottleneck in the cycle, thus making it a factor in limiting plant productivity (19–21). To better understand why photosynthetic eukaryotes possess two different phosphatases, we have conducted a study of SBPase using the enzyme from a moss, Physcomitrella patens (Pp), which gave stable preparations that could be crystallized. We have characterized FBPase in parallel for comparison and found that, although the two enzymes possess overall similar 3D architecture at the subunit level, they have different evolutionary histories: FBPase is derived from bacteria in conjunction with the endosymbiotic event that gave rise to mitochondria, whereas SBPase is of archaeal origin.
Results and Discussion
Three-Dimensional Structure of the P. patens Phosphatases.
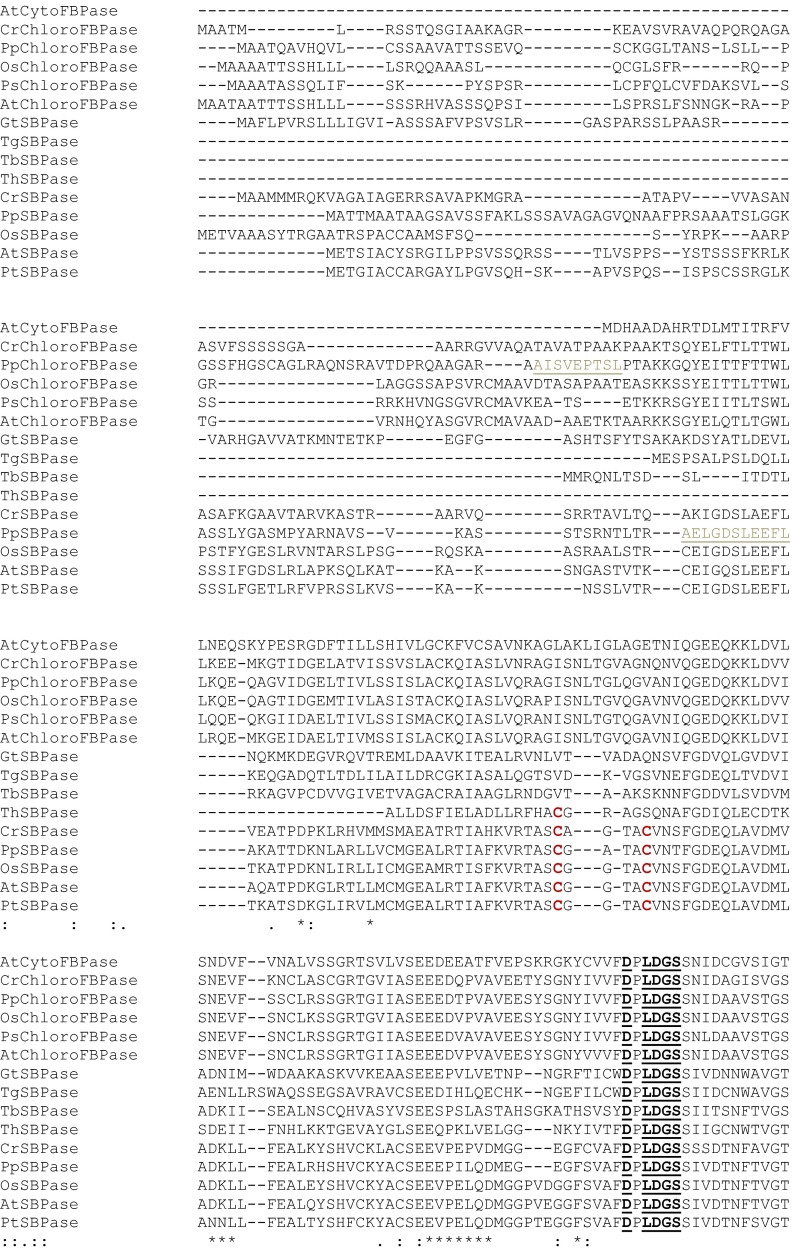
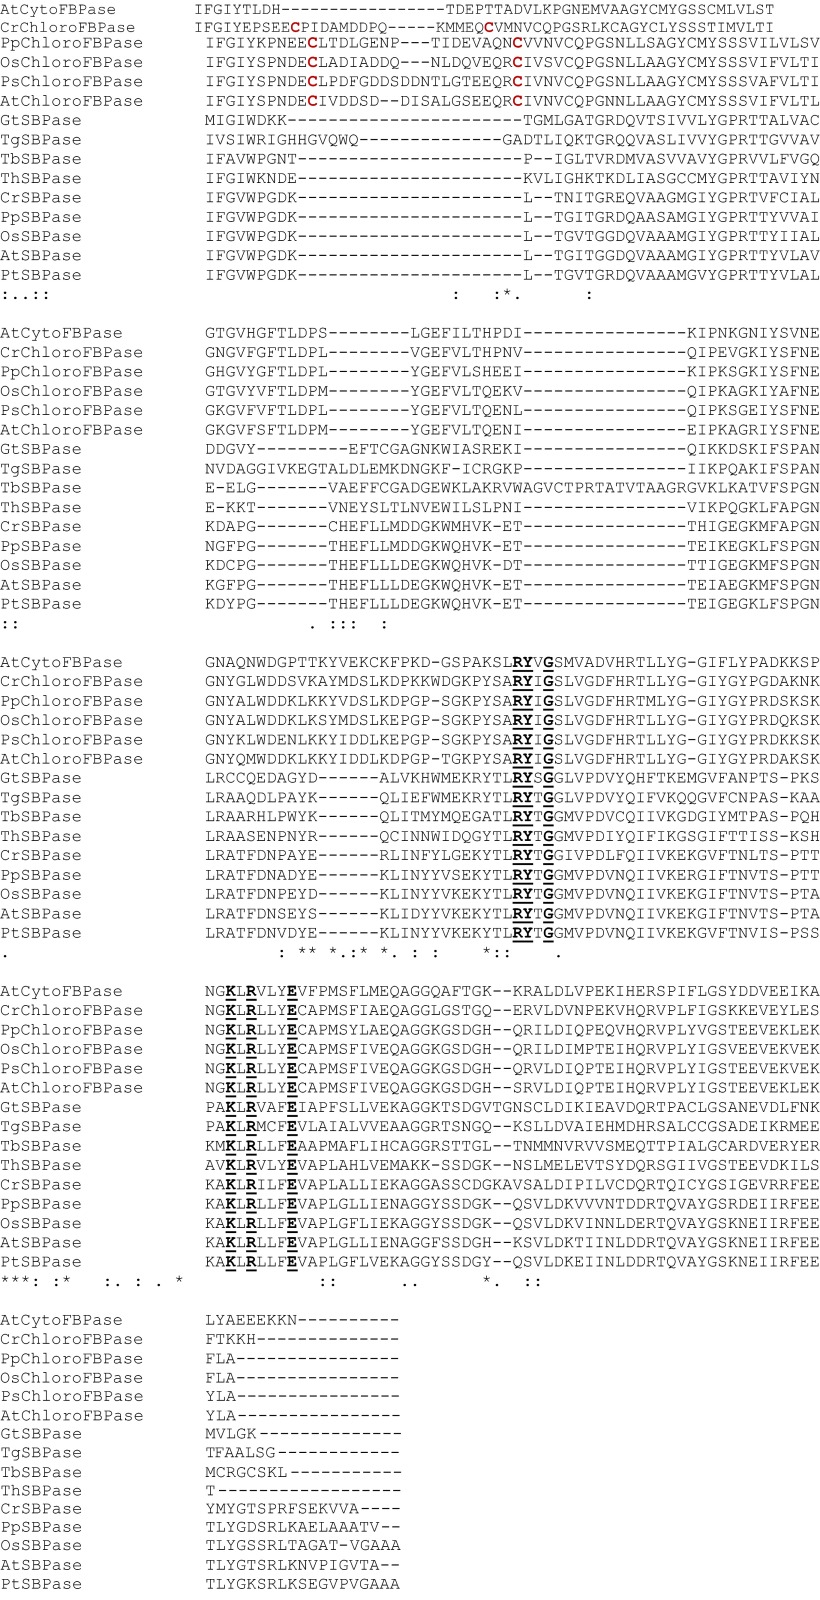
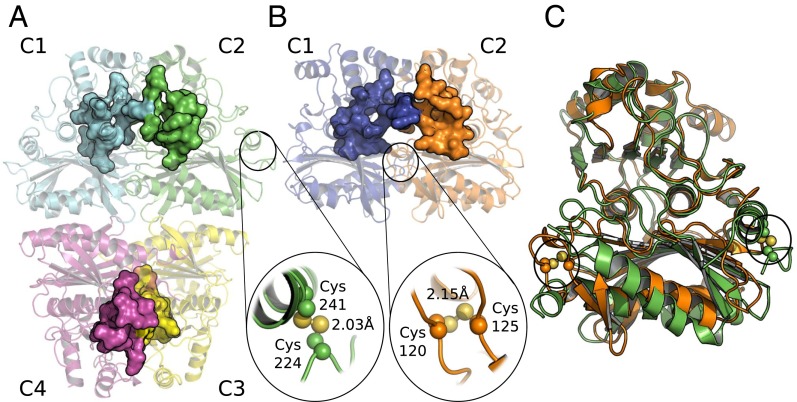
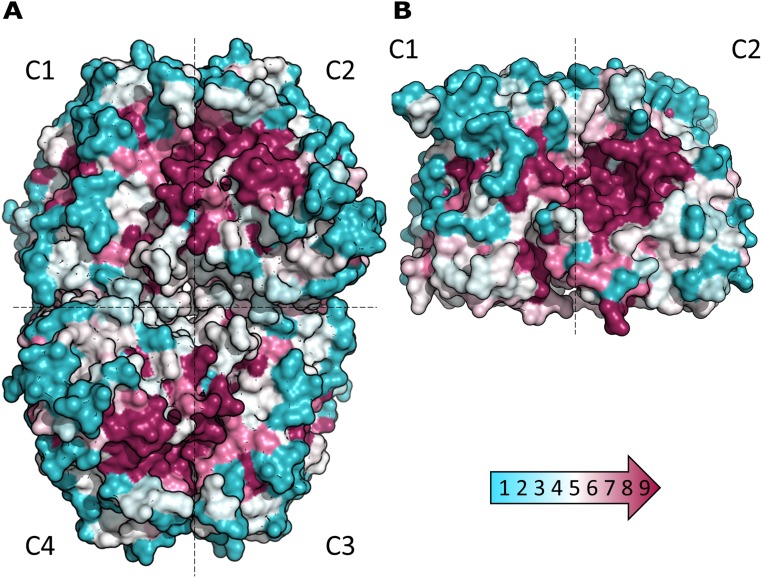
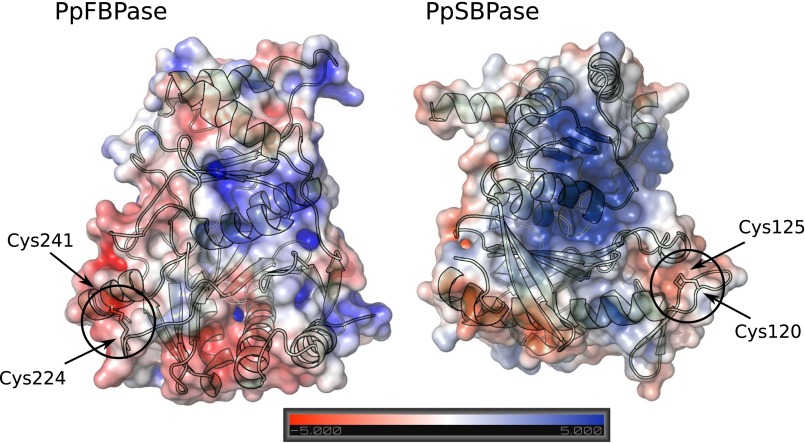
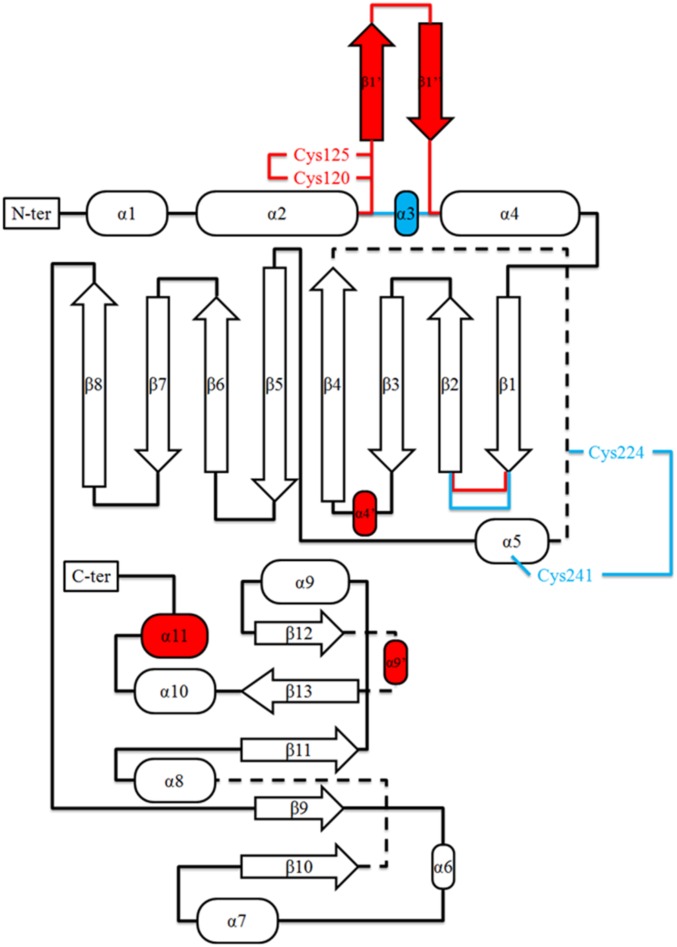
At the outset, we sought to understand the basis for differences in the regulatory properties of the TRX-linked FBPase and SBPase enzymes. One possibility was that the regulatory differences might be explained by each enzyme having a unique structure. However, earlier modeling of the wheat enzyme (19) together with the available structure of the nonregulatory Toxoplasma gondii SBPase (PDB ID code 4IR8) pointed in another direction. To better understand the relationship between FBPase and SBPase, we examined their 3D structures. To this end, we purified the two enzymes using combinations of classical chromatography techniques and were able to crystallize both in the oxidized form. The chloroplast redox-dependent SBPase had not previously been crystallized or its 3D structure investigated. In parallel, we compared major properties of SBPase relative to FBPase. The structure of a putative SBPase has been previously determined from yeast [Saccharomyces cerevisiae; Protein Data Bank (PDB) ID code 3OI7], but it is very divergent from the plant SBPase described here (22). As seen in Fig. S1, chloroplast FBPase and SBPase of P. patens display ∼25% sequence identity at the amino acid level. Further, the putative redox-sensitive cysteine residues of both enzymes are conserved throughout the plant kingdom (see alignment in Fig. S1). The redox-insensitive cytosolic FBPase, by contrast, lacks an insertion of about 20 amino acids in the regulatory loop of chloroplast FBPase. PpFBPase (PDB ID code 5IZ1) and PpSBPase (PDB ID code 5IZ3) crystallized in space groups P21 and P2221 with one tetramer and one dimer, respectively, per asymmetric unit. In the D2-symmetric PpFBPase tetramer, the C1–C2 dimer is rotated 60° relative to the C4–C3 dimer (interface of 2,023 Å2 between these two dimers), resulting in a form similar to the T-state conformation of the porcine FBPase (23). Both structures (Fig. 1 A and B) were solved by molecular replacement at 3.0-Å resolution for PpFBPase and to a higher resolution of 1.3 Å for PpSBPase. The interfaces C1–C2 in PpSBPase and C1–C2 and C3–C4 in PpFBPase are quite large (2,103 and 2,128 ± 15 Å2 for PpSBPase and PpFBPase, respectively) compared with the interfaces C1–C4 and C2–C3 in the PpFBPase tetramer (961 ± 23 Å2). Moreover, residue conservation (Fig. S2), plotted onto PpFBPase and PpSBPase surfaces using the ConSurf server (24) with the UniRef90 database (www.uniprot.org/uniref/), shows that the C1–C2 (or C4–C3) interface (including the active site) is well-conserved (score of 6.81) compared with the C1–C4 and C2–C3 interfaces (score of 4.97). The calculated electrostatic potential of the molecular surfaces shows that the regulatory regions are clustered with negative residues on both enzymes (Fig. S3), and thereby are highly attracted to the positively charged TRX molecules. This observation was previously proposed for spinach FBPase (25). A superposition of monomers of the two enzymes (Fig. 1C) shows a similar fold with a root-mean-square deviation (rmsd) of 1.35 Å for 180 Cα atoms. The monomer topology consists in both cases of two β-sheets surrounded by α-helices (Fig. S4). In PpSBPase, a β-hairpin is formed in the α2–α4 loop containing Cys120 and Cys125 instead of helix α3 in PpFBPase. In PpFBPase, the β4–β5 loop containing Cys224 and Cys241 is extended with respect to the corresponding loop in PpSBPase by 22 amino acids (34 vs. 12 residues). The electron density for both enzymes clearly reveals the presence of a disulfide bond between the sulfur atoms of the two regulatory cysteine residues (PpFBPase Cys224–Cys241; PpSBPase Cys120–Cys125). In PpSBPase, the two cysteines forming the redox-regulated disulfide bond are located at the interface of the dimer. In the case of FBPase, early mutagenesis studies of the pea ortholog yielded ambiguous results in identifying the regulatory site. Cys153 (PpCys224), the first cysteine of the insertion, was absolutely required, whereas the variants of Cys173 (PpCys241) and Cys178 (PpCys246) partially retained the capacity for redox regulation (26). Chiadmi et al. (16) later published the structure of the oxidized pea enzyme, which showed an unequivocal disulfide between Cys153 and Cys173 at the outer corners of the monomer. The structure for oxidized PpFBPase presently reported confirms the role of these two cysteines in disulfide formation. The distances between the sulfur atoms of the cysteine residues 224/246 and 241/246 in PpFBPase are more than 7 Å for both pairs, so that disulfide formation would require a major conformational rearrangement, as was suggested to occur between Cys153 and Cys178 in the pea C173S mutant (16). In our X-ray structures, the redox-regulatory disulfides were shown to be surface-exposed and remote from the sugar bisphosphate binding sites. Based on a crystallographic comparison with the pig kidney enzyme, it was postulated that the reduction of the disulfide of pea FBPase provoked a shift in the position of several β-strands, resulting in the reorientation of a critical glutamate side chain necessary for cofactor binding (16). At this point, the structural rearrangements leading to reductive SBPase activation are yet to be defined.
Fig. S1.
Alignment of selected FBPase and SBPase amino acid sequences with Clustal Omega (www.ebi.ac.uk/Tools/msa/clustalo/). At, Arabidopsis thaliana; Cr, Chlamydomonas reinhardtii; Gt, Guillardia theta; Os, Oryza sativa; Pp, Physcomitrella patens; Ps, Pisum sativum; Pt, Populus trichocarpa; Tb, Trypanosoma brucei; Tg, Toxoplasma gondii; Tt, Tetrahymena thermophilia. Chloro, chloroplastic; Cyto, cytosolic. Red/bold, redox-sensitive cysteines; bold/underlined, conserved residues in FBPase and SBPase in the potential sugar bisphosphate binding site; brown/underlined, start of the recombinant proteins.
Fig. 1.
Structural overview of PpFBPase (PDB ID code 5IZ1) and PpSBPase (PDB ID code 5IZ3). Regulatory cysteines are highlighted. The active sites are represented as surface areas for each monomer. (A) PpFBPase. (B) PpSBPase. (C) Superposition of PpFBPase (green) and PpSBPase (orange) monomers.
Fig. S2.
ConSurf analysis for PpFBPase (A) and PpSBPase (B). Multiple sequence alignment was built with the alignment method MAFFT using the CS-BLAST search algorithm for homologs (ranging from 10% to 90% sequence identity) from the UniRef90 database. Residue conservation is plotted onto the surface of both enzymes and is colored according to conservation scores ranging from 1 (cyan, low conservation) to 9 (purple, high identity). The figure reveals that the active sites of both enzymes are highly conserved and that the C1–C2 and C3–C4 interfaces are well-conserved, unlike the C1–C4 and C2–C3 interfaces of PpFBPase. The information was obtained and is shown using the PyMOL output file from the ConSurf server (24).
Fig. S3.
Electrostatic potential of the molecular surface of PpFBPase and PpSBPase monomers. Negatively charged residues are colored in red; positively charged areas are colored in blue; and neutral regions are indicated in white.
Fig. S4.
Topology diagram of P. patens FBPase and comparison with SBPase. Structural elements shared between PpFBPase and PpSBPase are colored in black, additional elements present in PpFBPase are colored in blue, and additional secondary structures present in PpSBPase are colored in red. The extended loop present in PpFBPase between the β1- and β2-strands is indicated.
Regulation of FBPase and SBPase of P. patens Chloroplasts.
Assay of SBPase.
The enzyme was ideally assayed by measuring Pi release from SBP. However, the lack of a reliable commercial source of SBP necessitated that we use an alternate procedure for large experiments. Therefore, in those cases, we measured activity with FBP as substrate. We found that the homogeneous enzyme could use FPB at 1/100th the rate observed with SBP. Therefore, unless stated otherwise, we monitored activity of SBPase with FBP.
Thioredoxin specificity.
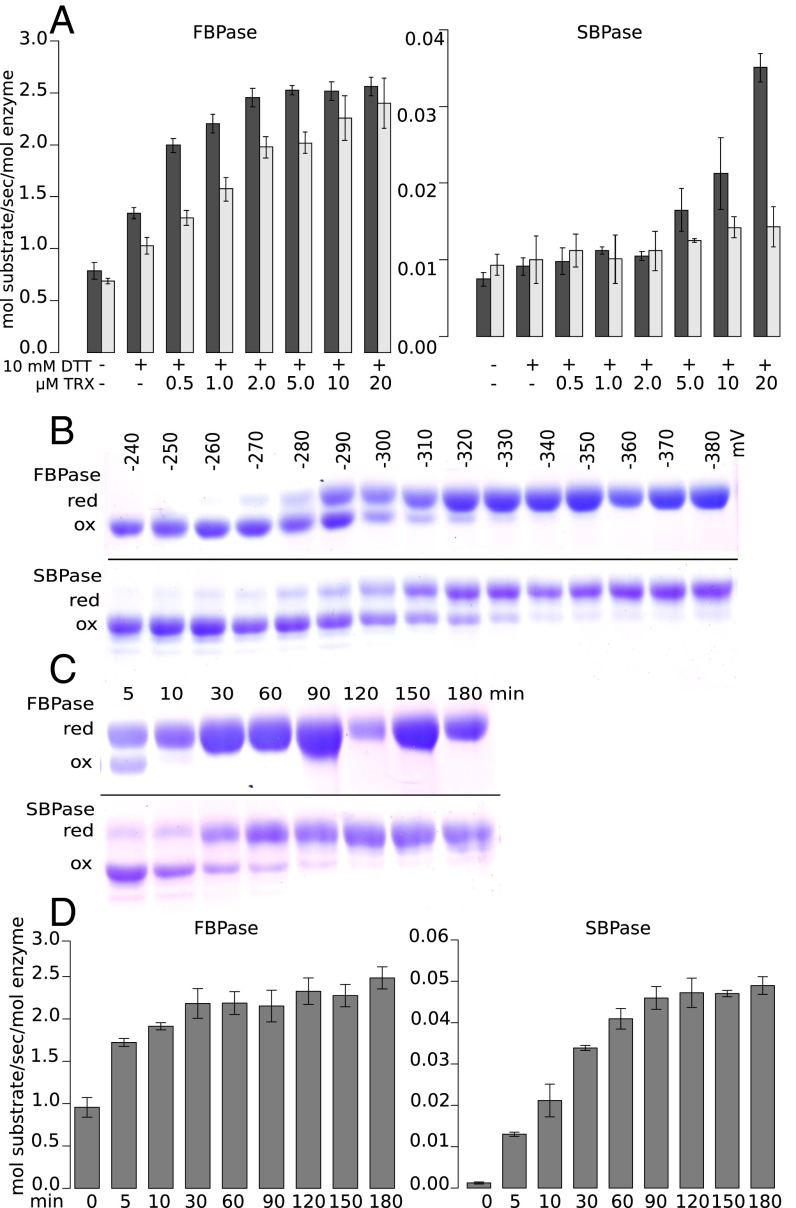
For optimal catalysis, FBPase and SBPase are reduced by the light-dependent ferredoxin/thioredoxin system or its nonphysiological in vitro replacement, DTT-reduced TRX. Because chloroplasts contain multiple classical TRXs (f, m, x, y, and z), we tested the effect of several different TRXs on the reductive activation of the enzyme. TRX z, as well as the atypical chloroplast TRX-like2.2, were unable to activate either phosphatase, whereas TRXs f and m were effective in the order f > m (Fig. 2A). PpFBPase was activated at all levels of TRXs f and m tested, but PpSBPase required relatively high levels of both redoxins and even then was only sluggishly activated by TRX m. Thus, PpFBPase activation saturated at about 2 µM TRX f and at 20 µM TRX m. The results show that, under these conditions, TRX m activated PpFBPase, in agreement with earlier reports (27, 28). We conclude that TRX f is more effective than TRX m in regulating the two phosphatases, as found originally (4), and that activation of SBPase by TRX m is marginal. TRXs x and y function in reactive oxygen species defense jointly with accessory enzymes and are not active with FBPase (6). Consequently, these proteins were not tested. The results demonstrate that the moss (bryophyte) phosphatase enzymes exhibit regulatory properties similar to the more advanced seed plant species. It has been proposed that redox regulation in its modern form appeared after the endosymbiotic event (29) and was later refined in land plants. In keeping with this idea, some years ago the NADP-dependent malate dehydrogenase (NADP-MDH) of Chlamydomonas reinhardtii was found to display regulatory properties intermediate between those of nonredox counterparts and the fully redox-controlled enzyme of land plants (30).
Fig. 2.
Regulatory aspects of PpFBPase and PpSBPase. (A) Dependency of phosphatases on thioredoxin. Dark gray bars show the activity of the enzymes reduced with TRX f, and light gray bars show the activity with TRX m. Activities are depicted in mol substrate transformed per s/mol enzyme. Both FBPase and SBPase activities were evaluated using the coupled spectrophotometric assay and the “alternate” FBP substrate for SBPase. (B) Redox potential. Midpoint redox potentials estimated by SDS/PAGE following methoxy-PEG (mPEG)-maleimide labeling. Both proteins were treated with various ratios of oxidized and reduced DTT and then labeled with mPEG-maleimide. The oxidation–reduction potential was read at the point indicating that the protein was half-oxidized and half-reduced. (C) Time course of reduction. mPEG-maleimide labeling by reduction with 10 mM DTT and 3 µM TRX f at pH 7.0. (D) Time course of activation. Experimental conditions were as in C. Red, reduced; ox, oxidized. Error bars in A and D represent standard deviation.
Redox potentials.
To gain further insight into the regulation of the phosphatases, we estimated the potentials of the redox-active disulfides of both enzymes following treatment with a varying amount of oxidized and reduced DTT plus a catalytic amount of TRX f. The resulting band pattern indicated that PpSBPase (−310 mV) has a slightly more negative reduction potential at pH 7.0 than PpFBPase (−290 mV) (Fig. 2B). This difference may be a reflection of the versatility of function: FBPase functions in both the Calvin–Benson cycle and starch synthesis, whereas SBPase has a role only in the former pathway.
Redox status vs. catalytic activity.
We next compared the relative reduction rates coupled with a measure of catalytic activity of the phosphatases. To this end, we reduced the proteins with a range of reductant (DTT) concentrations and stopped the reaction after different incubation times to measure the extent of reduction by gel electrophoresis and enzyme activity by biochemical assays. The experiments were carried out at pH 7.0 to slow the reduction/activation process and the onset of activity. As seen in Fig. 2 C and D, PpFBPase was almost completely reduced after 10–30 min, whereas PpSBPase was only partially reduced after 90 min. The rate of reduction of both phosphatases correlated with the appearance of catalytic activity, unlike earlier observations with NADP+-dependent malate dehydrogenase, where reduction was substantially faster than activation (31, 32). The absence of such a hysteretic effect with the phosphatases (4) is possibly linked to a simpler mechanism of activation. Both enzymes possess only a single disulfide per subunit, compared with NADP-MDH with two regulatory disulfides that necessitate an interconversion with an additional, internal cysteine. Our experiments thus suggest that the molecular movements required to activate the phosphatases are more restricted than for NADP-MDH. Moreover, under identical experimental conditions, PpFBPase is reduced and activated faster than PpSBPase and is thus less tightly controlled by change in redox status in most situations. Again, these differences may reflect the need to separate fine control of starch synthesis from the Calvin–Benson cycle.
Enzyme Kinetics and Substrate Specificity.
Mg2+ requirement.
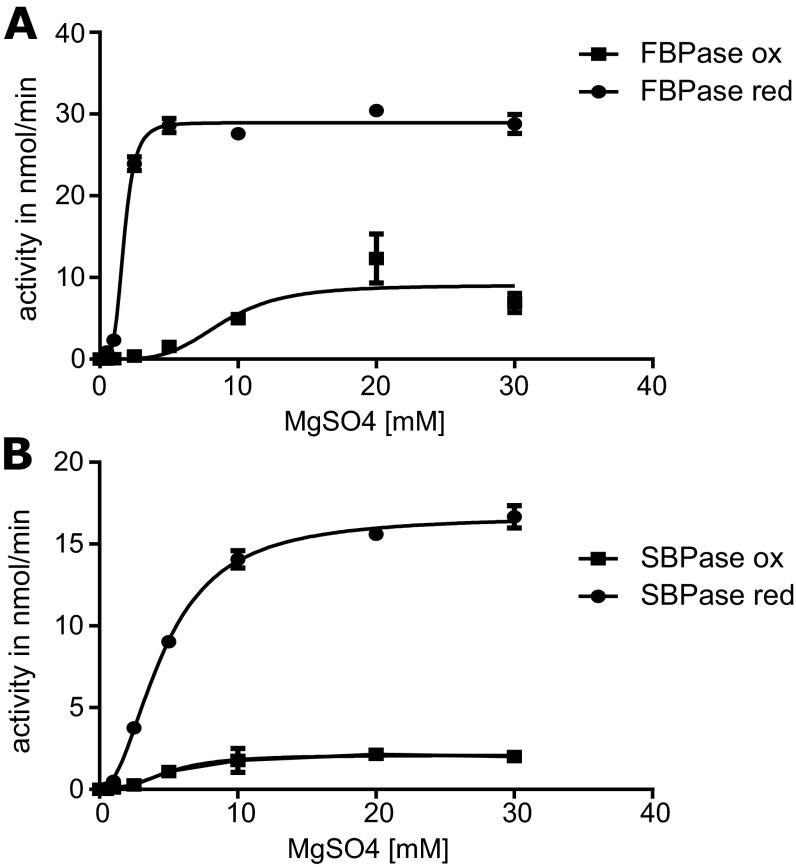
Because Mg2+ is an essential cofactor for both phosphatases, we studied its requirement for the oxidized and fully reduced enzymes. Determination of the half-maximal saturation concentration (S0.5) of the cofactor revealed differences dependent on the redox state in both cases. Thus, oxidized PpFBPase had a relatively high Mg2+ requirement to reach half-maximal velocity (S0.5 8.9 mM), whereas the reduced enzyme needed much less (S0.5 1.7 mM). For PpSBPase, we obtained similar S0.5 values for the oxidized and reduced enzyme forms (4.9 and 4.6 mM, respectively). The activities observed with the oxidized forms of both phosphatases (Fig. S5) were much lower than with the reduced counterparts (ca 20% and 10% activity for PpFBPase and PpSBPase, respectively). Based on the results with DTT, PpSBPase would be activated at least 8-fold and PpFBPase up to 30-fold by light under physiological conditions (ca 3–5 mM stromal Mg2+) (33, 34). The results further suggest that reduced PpFBPase would respond actively to light-dependent changes in stromal Mg2+, whereas PpSBPase would be less responsive.
Fig. S5.
Requirement of PpFBPase (A) and PpSBPase (B) for Mg2+. Results are shown for both the oxidized (ox) and reduced (red) enzymes with FBP as substrate. Error bars represent standard deviation.
Substrate specificity.
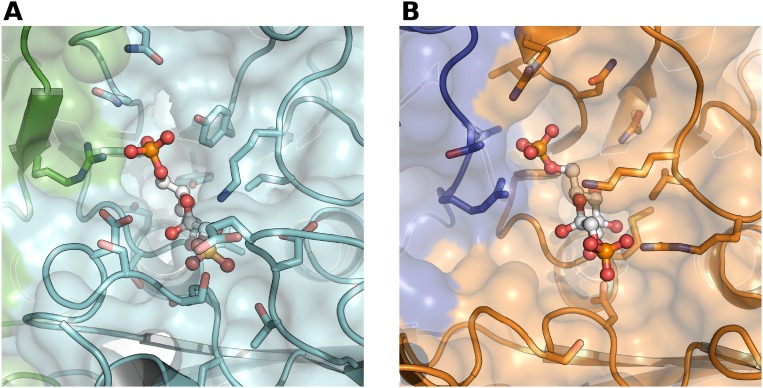
Whereas PpSBPase was catalytically active with both FBP and SBP, FBP activity was about 1% that of SBP. When using the coupled assay and FBP as a substrate, reduced PpSBPase displayed a Km (FBP) value of 0.23 mM and a kcat of 0.037 s−1 (kcat/Km 161 M−1s−1), and reduced PpFBPase gave a Km value of 0.165 mM and a kcat of 2.66 s−1 (kcat/Km 16,121 M−1s−1). The direct measurement of phosphate released in the reaction led to catalytic rates at least fivefold higher than those estimated in the coupled spectrophotometric assay, and hence the kcat/Km values were greatly underestimated. We attribute this difference to poor coupling efficiency under the assay conditions. Indeed, we observed that the kinetics of NADP+ reduction with both enzymes were far from linear, with a lag phase likely corresponding to the buildup of fructose 6-phosphate. Nevertheless, the coupled assay allowed a convenient means of estimating FBP Km values. Using the direct determination of Pi released with the physiological SBP substrate by PpSBPase yielded the kcat value of 12.2 s−1 (vs. 0.037 s−1 with FBP), reflecting the much higher activity with the actual substrate. We failed to detect phosphate release by the PpFBPase enzyme assayed with SBP even when increasing the amount of enzyme to very high levels. We therefore compared the ligand binding sites of both enzymes in the protein structures we obtained. Based on homology modeling and docking, 15 residues are involved in FBP binding in the PpFBPase active site (Fig. S6). The comparison of PpFBPase and PpSBPase active sites shows that 12 out of 16 residues are conserved between the two enzymes, with Thr180, Tyr355, and Tyr357 of PpFBPase being replaced by Glu160, Phe311, and Asn313 in PpSBPase (Table S1). Moreover, the loop partially covering the active site between strands β1 and β2 is larger (eight residues) for PpFBPase than for PpSBPase (four residues) (Fig. S4). Solvent-accessible surface areas of 1,056 and 1,153 Å2 were calculated using the PDBePISA server (www.ebi.ac.uk/pdbe/prot_int/pistart.html) for the PpFBPase and PpSBPase active sites, respectively. This difference may explain why PpSBPase is much more active with the larger SBP substrate than with FBP, and why PpFBPase is active only with FBP—that is, its sugar phosphate binding site is too constricted to accommodate the larger substrate.
Fig. S6.
Close-up view of both FBP and SBP surface binding sites based on homology modeling from 3D known structures. (A) Putative FBP binding site of PpFBPase with monomers A and B colored green and cyan, respectively. (B) Putative SBP binding site of PpSBPase with monomers A and B colored blue and orange, respectively. In each case, secondary structures are shown as cartoons, residues potentially involved in substrate binding are shown as sticks, and substrate molecules (FBP or SBP) are colored white and shown in a ball-and-stick representation. Both FBP and SBP molecules are stabilized through hydrogen bonds formed by ∼15 residues, including Arg336 for PpFBPase (Arg291 for PpSBPase) located within the other monomer.
Table S1.
Ligand comparison of PpFBPase and PpSBPase active sites
| FBP binding site | Equivalent residues in PpSBPase |
| 180-Thr | 160-Glu |
| 197-Asp | 178-Asp |
| 199-Leu | 180-Leu |
| 200-Asp | 181-Asp |
| 201-Gly | 182-Gly |
| 202-Ser | 183-Ser |
| 305-Asn | 266-Asn |
| 336-Arg | 291-Arg |
| 337-Tyr | 292-Tyr |
| 339-Gly | 294-Gly |
| 341-Leu | 296-Met |
| 355-Tyr | 311-Phe |
| 357-Tyr | 313-Asn |
| 367-Lys | 322-Lys |
| 369-Arg | 324-Arg |
| 373-Glu | 328-Glu |
Phylogenetic Considerations.
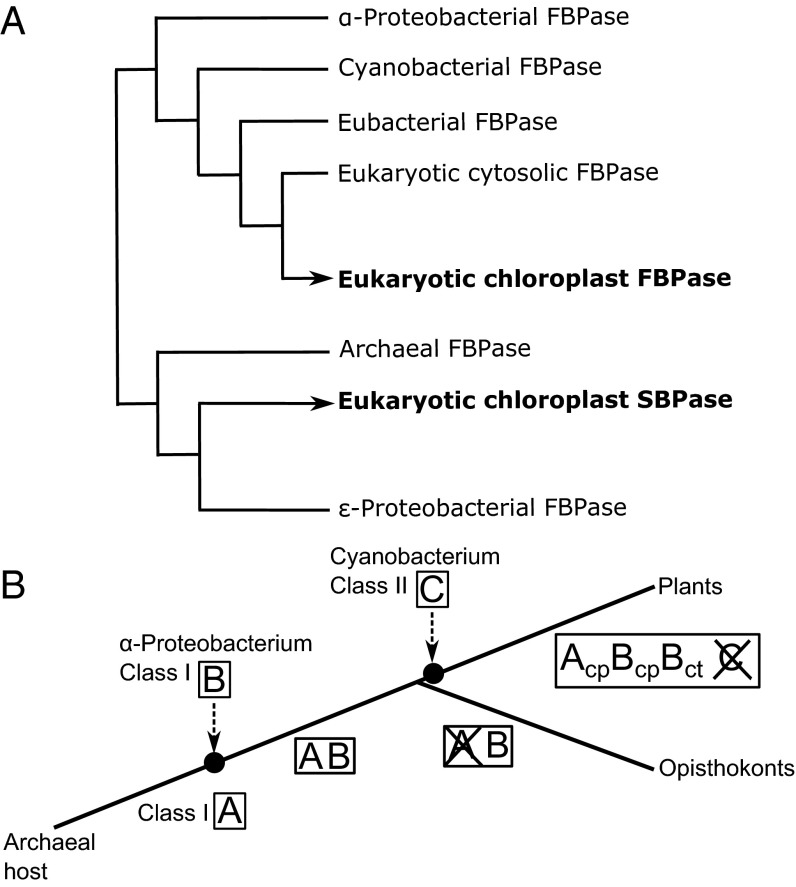
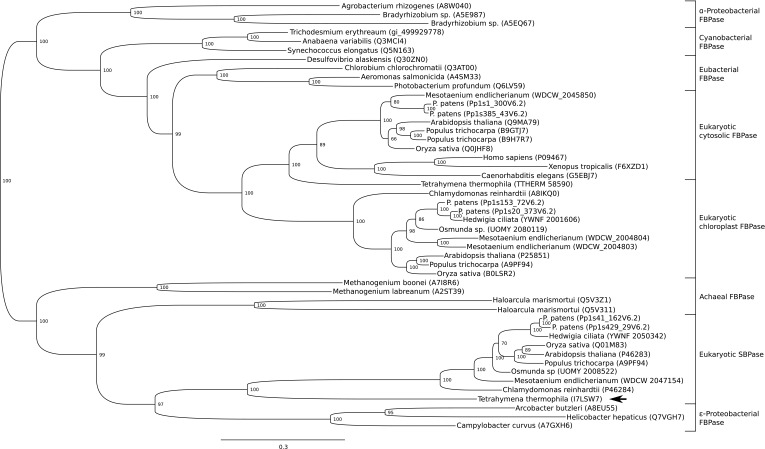
The Calvin–Benson cycle has a unique organization in photosynthetic eukaryotes, with the individual enzymes arising from different organisms during evolution. Certain members of the cycle (e.g., glyceraldehyde 3-phosphate dehydrogenase and phosphoribulokinase) have a cyanobacterial origin and were acquired specifically in the green lineage, whereas others appear to be derived from genes present in the last common ancestor of eukaryotes (35). The origin of FBPase and SBPase has long been under debate. Two classes of FBPase, I and II, can be distinguished by different catalytic domains (FBPase and FBPase_glpX domain, respectively) (36). Most eubacteria have a class I FBPase, with some possessing class I F/SBPase hybrids, whereas some cyanobacteria have class II-derived hybrid F/SBPases. By contrast, chloroplast and cytosolic FBPase as well as SBPase harbor class I domains based on amino acid sequence comparisons. Moreover, plants and animals possess a cytosolic FBPase clustering to the same phylogenetic clade, making a cyanobacterial origin unlikely. Jiang et al. earlier proposed that ε-proteobacteria are most closely related to SBPase, whereas FBPase groups with another clade of class I eubacterial FBPases (37). We conducted further comprehensive gene sequence analyses confirming that the substrate-specific phosphatases are not sister to one another and showing that they have been recruited independently during eukaryotic evolution (Fig. 3A; see a detailed version in Fig. S7). Considering recent evidence that most eubacteria-derived genes were acquired during endosymbiotic events in eukaryotic evolution (38) and that an ancestor of extant archaea was the host for formation of the first eukaryote (39), a novel scenario becomes more plausible: Our phylogenetic analysis suggests that cytosolic and plastid FBPases of plants are more closely related to α-proteobacterial precursors and that chloroplast SBPases are closer to archaeal FBPases. Accordingly, it seems feasible that the last common ancestor of eukaryotes harbored two types of FBPases: (i) one derived from the archaeal host, later evolving to the plastid-targeted SBPase in plants, and (ii) an α-proteobacterial FBPase, likely acquired during the endosymbiotic event leading to formation of the first eukaryote (Fig. 3B). The original SBPase ancestor might have been lost in opisthokonts (Fig. 3B). This conclusion is supported by the finding that the SBPase gene is present in several unicellular eukaryotes that may have acquired it by secondary endosymbiosis of phototrophic eukaryotes (40). Notably, the regulatory cysteines have been either partially or completely lost from the SBPase genes, as seen, for example, in the alveolate Tetrahymena thermophila (Figs. S1 and S7). Irrespective of evolutionary origin, chloroplast FBPase and SBPase subsequently independently acquired the same mechanism of redox regulation under the control of ferredoxin, FTR, and TRX, although the positions of the regulatory sites both in the amino acid sequence and in the 3D structure are radically different. It remains to be seen why evolution has chosen two distinct sites on the highly structurally homologous FBPase and SBPase to implement a very similar regulatory principle. Examining a number of chloroplast redox-regulated enzymes, we have earlier made the proposal that acquisition of redox regulation responds to structural constraints inherent to each catalyst and that there cannot be a universal regulatory module fitting all regulatory enzymes (41). There are in the literature a number of studies dealing with the evolution of structures and active sites along temperature gradients (essentially comparing psychrophilic, hyperthermophilic, and mesophilic enzymes catalyzing identical reactions). In directed evolution it has been observed that the opening of larger cavities at the active site essentially correlates with modifications in the loops bordering these positions with the possible removal of bulky amino acid chains. Interestingly, in our situation, changes of that sort occur near the active and regulatory sites. Our data suggest that the FBPase–SBPase comparison is an example of natural selection achieving results similar to those reported in directed evolution for lipase and amylase in particular (42–44).
Fig. 3.
Evolutionary origin of eukaryotic FBPase and SBPase. (A) Simplified version of the phylogenetic analysis performed (a detailed version is in Fig. S7). (B) Scheme illustrating the most parsimonious scenario for the acquisition and loss of FBPase and SBPase enzymes during evolution. A, SBPase; B, FBPase; C, cyanobacterial bifunctional enzyme; cp, chloroplastic; ct, cytosolic.
Fig. S7.
Phylogenetic tree of FBPases and SBPases. The 48 amino acid sequences used include 4 archaeal FBPases, 3 ε-proteobacterial FBPases, 10 eukaryotic SBPases, 3 α-proteobacterial FBPases, 4 eubacterial FBPases, 3 cyanobacterial FBPases class I, 11 eukaryotic cytosolic FBPases, and 10 eukaryotic chloroplast FBPases (for details, see Materials and Methods and Dataset S1). All α-proteobacterial FBPases consistently clustered with eukaryotic FBPases, and all archaeal FBPases with plant SBPases. Considering that horizontal gene transfer is continuously happening between prokaryotes (resulting in pangenomes) and that most prokaryote-derived genes were acquired during endosymbiotic events in eukaryotic evolution (38), the phylogenetic distribution we observed indicates that plant and animal FBPases originated from an α-proteobacterial ancestor, whereas plant SBPases originated from an archaeal ancestor. The arrow depicts the loss of one regulatory cysteine in a putatively secondary heterotrophic lineage, the alveolate T. thermophila.
Concluding Remarks
Two differences stand out in distinguishing chloroplast SBPase and FBPase at the protein level: (i) the solvent-accessible surface areas of their active sites, and (ii) the nature and relative positioning of their redox-active regulatory disulfides. As perhaps would be expected, the active-site solvent-accessible surface area for SBPase was found in this study to be significantly larger than for FBPase, thus allowing the accommodation of the seven-carbon sugar phosphate. This size difference is reflected in the substrate specificity of the enzymes. SBPase with the larger surface area hydrolyzes both the seven-carbon substrate SBP and the smaller six-carbon FBP, although it is much less effective with the latter. By contrast, whereas highly active with FBP, FBPase with the smaller active-site surface area is inactive with SBP. It remains to be seen whether this specificity difference has physiological consequences. Interestingly, the plant mutants with decreased SBPase activity have a much stronger phenotype than the chloroplast FBPase ones (45). We suggest that in FBPase mutants, either cytosolic FBPase with the help of either a transport system or SBPase can substitute to some extent for authentic FBPase. Obviously, our results indicate that the opposite is not true, explaining the more marked phenotype linked to the SBPase mutants. More mysterious is the basis for the difference in the regulatory sites. The two redox-active cysteines have long been known to differ not only in their adjoining amino acids but also in their placement in the proteins. Initially, we thought that knowledge of the structure of the SBPase and FBPase enzymes might help explain these differences. However, this turned out not to be the case: Despite their low amino acid sequence identity, the proteins display highly similar folds at the subunit level similar to what was observed for thioredoxin and glutaredoxin. Moreover, there were no striking differences in redox potentials or in the activity parameters altered on reduction by TRX. Our evidence suggests that FBPase was derived from bacteria in conjunction with the endosymbiotic event giving rise to mitochondria, and that SBPase was derived from an archaeal gene, putatively present in the host cell. It is remarkable that enzymes derived from genes with such different histories were adapted to embrace the same mechanism of regulation by redox transitions—that is, catalytic activity under the control of light, ferredoxin, and a thiol/disulfide regulatory chain. It is becoming fascinating to understand the evolutionary changes in the enzymes that made this adaptation possible. Lessons learned here could apply to other enzymes of the Calvin–Benson cycle.
Materials and Methods
Preparation of Recombinant PpFBPase and PpSBPase.
cDNA from PpFBPase (1sPp153_72) and PpSBPase (1sPp41_162) was amplified by PCR (primers are listed in Table S2) and cloned in pET expression vectors. The proteins were produced in Escherichia coli and purified by several purification steps (for details, see SI Materials and Methods).
Table S2.
Primers used for cloning the cDNA of PpFBPase and PpSBPase
| Gene_ID | Primer sequence, 5′–3′ |
| 153_72_FWD | CCCCCCCCCATATGGCAATTTCCGTGGAGCC |
| 153_72_REV | CCCCGGATCCTTAAGCTAAGAACTTCTCCAAC |
| 41_162_FWD | CCCCCCCCATGGCAGAGCTCGGCGACAG |
| 41_162_REV | CCCCGGATCCTACACAGTGGCAGCGGCGA |
The NdeI (CATATG), BamHI (GGATCC), and NcoI (CCATGG) restrictions are underlined. Based on these sequences, FBPase is predicted to start with the sequence MAISVEP and end with LEKFLA. After the expected cleavage of the initial methionine, the subunit is predicted to contain 355 amino acids with a theoretical molecular mass of 38,528.4 Da. SBPase is predicted to start with the sequence MAELGDS and end with ELAAATV. After the expected cleavage of the initial methionine, the subunit is predicted to contain 317 amino acids with a theoretical molecular mass of 34,163.6 Da.
Crystallization and Structure Determination.
The crystals obtained were analyzed by X-ray diffraction, and the structure was solved by molecular replacement (see SI Materials and Methods and Table S3 for detailed information).
Table S3.
Data collection and processing
| Data collection and refinement | PpFBPase | PpSBPase |
| Data collection | ||
| Diffraction source | Cu-Kα | SLS X06SA |
| Detector | mar345dtb | Dectris Pilatus 6M |
| Wavelength, Å | 1.5418 | 1.0001 |
| Unit-cell parameters, Å, ° | a = 73.2, b = 84.47, c = 105.11, α,γ = 90, β = 104.66 | a = 45.2, b = 70.4, c = 197.2, α,β,γ = 90 |
| Space group | P21 | P2221 |
| Resolution range, Å | 100.00–3.00 (3.08–3.00) | 100.0–1.30 (1.32–1.30) |
| Total no. of reflections | 692,465 | 1,662,587 |
| No. of unique reflections | 21,663 (485) | 155,382 (6,941) |
| Average multiplicity | 3.6 (2.5) | 10.7 (3.7) |
| Mean I/σ(I) | 8.8 (1.9) | 30.6 (0.96) |
| Completeness, % | 88.5 (60.1) | 99.3 (90.2) |
| Rmerge | 0.120 (0.390) | 0.067 |
| Rmeas | 0.148 (0.479) | 0.070 |
| Rpim | 0.074 (0.262) | 0.024 (0.604) |
| CC1/2 | 0.993 (0.899) | 0.998 (0.522) |
| Refinement | ||
| Resolution range, Å | 100.00–3.00 (3.08–3.00) | 98.62–1.30 (1.33–1.30) |
| Rwork | 0.257 | 0.160 |
| Rfree | 0.315 | 0.191 |
| No. of protein atoms | 9,856 | 4,993 |
| No. of waters | — | 623 |
| rmsd, bond lengths, Å | 0.010 | 0.025 |
| rmsd, bond angles, ° | 1.399 | 2.317 |
| Ramachandran, favored, % | 90.24 | 95.88 |
| Ramachandran, allowed, % | 6.98 | 3.95 |
| Ramachandran, outliers, % | 2.78 | 0.17 |
| Average B factor, Å2 | 55.9 | 19.24 |
| PDB ID code | 5IZ1 | 5IZ3 |
Enzyme Activity Assays.
The TRXs used for the assays were overexpressed in E. coli, and the sequences were retrieved from Pisum sativum (TRX f) (46) and C. reinhardtii (TRX m) (47).
Coupled Assay for FBP Hydrolysis.
The activity of the enzymes determined with FBP as substrate was measured spectrophotometrically at 340 nm in a coupled system. The reduction of NADP+ was followed at 340 nm and the slope values were calculated. The reaction mix (in 500 µL) contained 0.2 mM NADP+, 30 mM Tris⋅HCl (pH 8.0), MgSO4 (3 mM with reduced enzymes; 16 mM with oxidized enzymes), 0.6 mM FBP, 0.1 units of glucose 6-phosphate dehydrogenase, and 0.1 units of phosphoglucose isomerase. For determining Km values, enzymes were incubated with 10 mM DTT and 3 μM TRX f for 1.5 h and assayed with FBP concentrations ranging between 0 and 1.5 mM. For determining Mg2+ requirement, Mg2+ concentrations ranged between 0 and 30 mM; the Hill equation was used to calculate S0.5. In TRX specificity assays, the phosphatase enzymes were preincubated at pH 8.0 at room temperature for 30 min with 10 mM DTT and different concentrations of the indicated TRX. For determining the time-dependent extent of reduction, assays were conducted with 10 mM DTT and 3 μM TRX f. Reactions were stopped by adding 50 μL 20% (wt/vol) TCA.
SBPase Assay.
The release of Pi was measured colorimetrically. After reduction with 10 mM DTT and 3 μM TRX f the activated enzyme was added to a 180-μL reaction mix containing 5 mM Mg2+ in 30 mM Tris⋅HCl (pH 8.0). After an 8-min incubation at room temperature, 800 μL Pi mix (2.5% sulfuric acid, 7.5 mM ammonium heptamolybdate, 100 mM FeSO4) was added and the Pi released was measured at 660 nm. Because we could not identify a reliable commercial source of SBP, we used a 1980s Sigma product (kindly provided by Peter Schürmann, University of Neuchâtel, Neuchatel, Switzerland) that gave reproducible results (mass spectrometric analysis confirmed that the compound was not degraded). SD of Pi release did not exceed 5%.
Midpoint Redox Potential Estimation.
Midpoint redox potentials were calculated from the relative concentration of reducing agent added during titration according to the Nernst equation (for details, see SI Materials and Methods).
Time Course of Reduction of Phosphatases.
Assay conditions were as described for midpoint potential measurements, except that 3 μM TRX f was included to ensure complete reduction.
Phylogenetic Analysis.
One portion of the sequences was selected based on the phylogenetic analysis performed by Jiang et al. (37), and the other portion was retrieved from Blast searches using the PpSBPase (Pp1s41_162) or PpFBPase (Pp1s153_72) protein sequence (48) as template with the 1KP webtool (www.onekp.com) and UniProt databank (www.uniprot.org). For alignment, Jalview (49) was used with the Muscle algorithm (default settings) and subsequently checked manually (Dataset S1). The C and N termini were trimmed manually according to the functional domains corresponding to amino acids 148–425 of PpFBPase. In total, 361 sites were used for calculation. The phylogenetic tree was built with MrBayes (version 3.1.2) software (50). The settings were adjusted to: aamodel, mixed; ngen, 1,000,000; samplefreq, 100; burn-ins, 2,500. After all generations, the SD of split frequencies was below 0.01. Numbers at branches represent posterior probabilities as inferred by MrBayes (version 3.1.2). The constructed tree was confirmed by achieving the same phylogenetic topology when using maximum-likelihood and neighbor-joining methods.
SI Materials and Methods
Preparation of Recombinant PpFBPase and PpSBPase.
Physcomitrella patens (Hedwig) Bruch, Schimp., & Gümbel was cultivated as described (51). For RNA isolation, TRIzol reagent (Life Technologies) was used with 100 mg fresh weight protonema tissue. SuperScript III Reverse Transcriptase (Life Technologies) was used to synthesize cDNA from 2 μg total RNA. The cDNAs encoding P. patens FBPase (1sPp153_72) and SBPase (1sPp41_162) were amplified by PCR (primers are shown in Table S3). The N terminus of the two enzymes was chosen by sequence comparison and extensive homology regions. After ligation into pET12a (FBPase) and pET3d (SBPase) vectors (Novagen), E. coli strain BL-21 was used for protein production. After a 4-h induction with 100 µM isopropyl β-d-1-thiogalactopyranoside, cells were harvested by centrifugation (5,000 × g, 10 min) and suspended in 20 mL 50 mM potassium phosphate buffer (pH 7.0) containing 1 mM EDTA. After sonication (2 min) and centrifugation (30,000 × g, 20 min, 4 °C), the nontagged phosphatase enzymes were purified by size-exclusion chromatography (SEC) on ACA 44 columns, DEAE ion-exchange chromatography, and, if required, a second SEC step on FPLC using a Superdex 200 16/600 column (GE Healthcare). Protein samples were stored in 50 mM potassium phosphate buffer (pH 7.0) containing 1 mM EDTA. For assays with SBP, the buffer was changed to 30 mM Tris⋅HCl (pH 7.5) supplemented with 1 mM EDTA. To verify their oligomeric state, enzymes were subjected to gel filtration with FPLC using a Superdex 200 10/300 GL column (GE Healthcare). PpSBPase consistently eluted as a dimer, whereas freshly prepared PpFBPase behaved as a tetramer.
Crystallization and Structure Determination.
Both proteins were crystallized by sitting-drop vapor diffusion. Protein in 0.5 µL was mixed with the same volume of reservoir solution. The best SBPase crystals grew within 3 wk at 8 °C, from a reservoir containing 40% (wt/vol) PEG 600 and 0.2 M imidazole/malate buffer at pH 5.5. FBPase crystals were obtained within ∼10 d at 20 °C, with a reservoir containing 0.1 M Bis-Tris buffer at pH 5.5 and 25% (wt/vol) PEG 3350. Crystals were flash-cooled in liquid nitrogen for storage and data collection. X-ray diffraction experiments were performed at 100 K either in-house on a Rigaku MicroMax 007HF rotating anode X-ray generator equipped with a mar research mar345dtb image plate detector, or on beamline X06SA of the Swiss Light Source (SLS; Paul Scherrer Institute) (Table S2). The datasets, with limiting resolutions of 3.0 (FBPase) and 1.3 Å (SBPase), were indexed and integrated using XDS (52) and scaled and merged with AIMLESS from the CCP4 package (53). The PpFBPase and PpSBPase structures were solved, respectively, by molecular replacement with MOLREP (54) of pea chloroplast FBPase (PDB ID code 1D9Q) and Toxoplasma gondii SBPase (PDB ID code 4IR8) as search models (16). Structures were built in Coot (55) and refined with REFMAC5 (56) (Table S3). The refined models were validated with MolProbity (57). The PpFBPase (355 residues; 71–425) structure includes residues 89–136, 146–225, and 233–425, whereas the PpSBPase (317 residues; 78–394) structure includes residues 79–394 (numbering includes the transit peptides). Several residues at the N-terminal extremity (1 for PpSBPase and 18 for PpFBPase) in addition to residues 137–145 and 226–232 for PpFBPase were disordered and thus could not be traced in the electron density map. The putative FBP binding site (Table S1) in PpFBPase was obtained by homology modeling using known FBPase structures (PDB ID codes 1FBH and 2Q8M) followed by an energy refinement with the YAMBER force field from the YASARA server (58).
Midpoint Redox Potential Estimation.
Mixtures of oxidized and reduced DTT dissolved in Hepes buffer (pH 7.0) were used as reductant. In time course experiments, 3 μM TRX f was added to achieve complete reduction. After a 3-h incubation in defined reductant/oxidant mixtures, samples were alkylated with mPEG 2000, which binds to free sulfhydryl groups and increases the mass of the monomer by ca 4,000 Da on SDS/PAGE. We used a range of −240 to −380 mV with 10-mV steps. All gels were developed at least in duplicate to provide reproducible results.
Supplementary Material
Acknowledgments
This article is dedicated to Peter Schürmann whose earlier work laid the foundation for the present study. We thank the staff at beamlines X06SA and X06DA of the Swiss Light Source for their excellent assistance during data collection, and also thank Andrew Karplus for helpful discussions. This work was supported by a grant overseen by the French National Research Agency (ANR) as part of the Investissements d’Avenir Program (ANR-11-LABX-0002-01, to J.-P.J.), (Laboratory of Excellence ARBRE, and ANR-11-LABX-0011 LABEX DYNAMO, to S.D.L.) and by the Excellence Initiative of the German Federal and State Governments (EXC294, to R.R.).
Footnotes
The authors declare no conflict of interest.
Data deposition: The crystallography, atomic coordinates, and structure factors reported in this paper have been deposited in the Protein Data Bank, www.pdb.org [PDB ID codes 5IZ1 (PpFBPase) and 5IZ3 (PpSBPase)].
This article contains supporting information online at www.pnas.org/lookup/suppl/doi:10.1073/pnas.1606241113/-/DCSupplemental.
References
- 1.Bassham JA, Krause GH. Free energy changes and metabolic regulation in steady-state photosynthetic carbon reduction. Biochim Biophys Acta. 1969;189(2):207–221. doi: 10.1016/0005-2728(69)90048-6. [DOI] [PubMed] [Google Scholar]
- 2.Michelet L, et al. Redox regulation of the Calvin-Benson cycle: Something old, something new. Front Plant Sci. 2013;4:470. doi: 10.3389/fpls.2013.00470. [DOI] [PMC free article] [PubMed] [Google Scholar]
- 3.Schürmann P, Jacquot J-P. Plant thioredoxin systems revisited. Annu Rev Plant Physiol Plant Mol Biol. 2000;51:371–400. doi: 10.1146/annurev.arplant.51.1.371. [DOI] [PubMed] [Google Scholar]
- 4.Buchanan BB. Role of light in the regulation of chloroplast enzymes. Annu Rev Plant Physiol. 1980;31:341–374. [Google Scholar]
- 5.Schürmann P, Buchanan BB. The ferredoxin/thioredoxin system of oxygenic photosynthesis. Antioxid Redox Signal. 2008;10(7):1235–1274. doi: 10.1089/ars.2007.1931. [DOI] [PubMed] [Google Scholar]
- 6.Serrato AJ, Fernández-Trijueque J, Barajas-López J-D, Chueca A, Sahrawy M. Plastid thioredoxins: A “one-for-all” redox-signaling system in plants. Front Plant Sci. 2013;4:463. doi: 10.3389/fpls.2013.00463. [DOI] [PMC free article] [PubMed] [Google Scholar]
- 7.Chibani K, et al. Atypical thioredoxins in poplar: The glutathione-dependent thioredoxin-like 2.1 supports the activity of target enzymes possessing a single redox active cysteine. Plant Physiol. 2012;159(2):592–605. doi: 10.1104/pp.112.197723. [DOI] [PMC free article] [PubMed] [Google Scholar]
- 8.Buchanan BB, Kalberer PP, Arnon DI. Ferredoxin-activated fructose diphosphatase in isolated chloroplasts. Biochem Biophys Res Commun. 1967;29(1):74–79. doi: 10.1016/0006-291x(67)90543-8. [DOI] [PubMed] [Google Scholar]
- 9.Schürmann P, Buchanan BB. Role of ferredoxin in the activation of sedoheptulose diphosphatase in isolated chloroplasts. Biochim Biophys Acta. 1975;376(1):189–192. doi: 10.1016/0005-2728(75)90217-0. [DOI] [PubMed] [Google Scholar]
- 10.Wolosiuk RA, Buchanan BB. Activation of chloroplast NADP-linked glyceraldehyde-3-phosphate dehydrogenase by the ferredoxin/thioredoxin system. Plant Physiol. 1978;61(4):669–671. doi: 10.1104/pp.61.4.669. [DOI] [PMC free article] [PubMed] [Google Scholar]
- 11.Wolosiuk RA, Buchanan BB. Regulation of chloroplast phosphoribulokinase by the ferredoxin/thioredoxin system. Arch Biochem Biophys. 1978;189(1):97–101. doi: 10.1016/0003-9861(78)90119-4. [DOI] [PubMed] [Google Scholar]
- 12.Zhang N, Portis AR., Jr Mechanism of light regulation of Rubisco: A specific role for the larger Rubisco activase isoform involving reductive activation by thioredoxin-f. Proc Natl Acad Sci USA. 1999;96(16):9438–9443. doi: 10.1073/pnas.96.16.9438. [DOI] [PMC free article] [PubMed] [Google Scholar]
- 13.Racker E, Schroeder EA. The reductive pentose phosphate cycle. II. Specific C-1 phosphatases for fructose 1,6-diphosphate and sedoheptulose 1,7-diphosphate. Arch Biochem Biophys. 1958;74(2):326–344. doi: 10.1016/0003-9861(58)90004-3. [DOI] [PubMed] [Google Scholar]
- 14.Majumder AL, Eisenberg F., Jr Unequivocal demonstration of fructose-1,6-bisphosphatase in mammalian brain. Proc Natl Acad Sci USA. 1977;74(8):3222–3225. doi: 10.1073/pnas.74.8.3222. [DOI] [PMC free article] [PubMed] [Google Scholar]
- 15.Breazeale VD, Buchanan BB, Wolosiuk RA. Chloroplast sedoheptulose-1,7-bisphosphatase: Evidence for regulation by the ferredoxin/thioredoxin system. Z Naturforsch Sect C Biosci. 1978;33(7–8):521–528. [Google Scholar]
- 16.Chiadmi M, Navaza A, Miginiac-Maslow M, Jacquot JP, Cherfils J. Redox signalling in the chloroplast: Structure of oxidized pea fructose-1,6-bisphosphate phosphatase. EMBO J. 1999;18(23):6809–6815. doi: 10.1093/emboj/18.23.6809. [DOI] [PMC free article] [PubMed] [Google Scholar]
- 17.Chueca A, Sahrawy M, Pagano EA, López Gorgé J. Chloroplast fructose-1,6-bisphosphatase: Structure and function. Photosynth Res. 2002;74(3):235–249. doi: 10.1023/A:1021243110495. [DOI] [PubMed] [Google Scholar]
- 18.Dunford RP, Catley MA, Raines CA, Lloyd JC, Dyer TA. Purification of active chloroplast sedoheptulose-1,7-bisphosphatase expressed in Escherichia coli. Protein Expr Purif. 1998;14(1):139–145. doi: 10.1006/prep.1998.0939. [DOI] [PubMed] [Google Scholar]
- 19.Dunford RP, Durrant MC, Catley MA, Dyer TA. Location of the redox-active cysteines in chloroplast sedoheptulose-1,7-bisphosphatase indicates that its allosteric regulation is similar but not identical to that of fructose-1,6-bisphosphatase. Photosynth Res. 1998;58(3):221–230. [Google Scholar]
- 20.Rosenthal DM, et al. Over-expressing the C(3) photosynthesis cycle enzyme sedoheptulose-1-7 bisphosphatase improves photosynthetic carbon gain and yield under fully open air CO(2) fumigation (FACE) BMC Plant Biol. 2011;11:123. doi: 10.1186/1471-2229-11-123. [DOI] [PMC free article] [PubMed] [Google Scholar]
- 21.Simkin AJ, McAusland L, Headland LR, Lawson T, Raines CA. Multigene manipulation of photosynthetic carbon assimilation increases CO2 fixation and biomass yield in tobacco. J Exp Bot. 2015;66(13):4075–4090. doi: 10.1093/jxb/erv204. [DOI] [PMC free article] [PubMed] [Google Scholar]
- 22.Clasquin MF, et al. Riboneogenesis in yeast. Cell. 2011;145(6):969–980. doi: 10.1016/j.cell.2011.05.022. [DOI] [PMC free article] [PubMed] [Google Scholar]
- 23.Ke HM, Liang JY, Zhang YP, Lipscomb WN. Conformational transition of fructose-1,6-bisphosphatase: Structure comparison between the AMP complex (T form) and the fructose 6-phosphate complex (R form) Biochemistry. 1991;30(18):4412–4420. doi: 10.1021/bi00232a007. [DOI] [PubMed] [Google Scholar]
- 24.Landau M, et al. ConSurf 2005: The projection of evolutionary conservation scores of residues on protein structures. Nucleic Acids Res. 2005;33(Web Server issue):W299–W302. doi: 10.1093/nar/gki370. [DOI] [PMC free article] [PubMed] [Google Scholar]
- 25.Rodriguez-Suarez RJ, Mora-García S, Wolosiuk RA. Characterization of cysteine residues involved in the reductive activation and the structural stability of rapeseed (Brassica napus) chloroplast fructose-1,6-bisphosphatase. Biochem Biophys Res Commun. 1997;232(2):388–393. doi: 10.1006/bbrc.1997.6242. [DOI] [PubMed] [Google Scholar]
- 26.Jacquot J-P, et al. Cysteine-153 is required for redox regulation of pea chloroplast fructose-1,6-bisphosphatase. FEBS Lett. 1997;401(2–3):143–147. doi: 10.1016/s0014-5793(96)01459-7. [DOI] [PubMed] [Google Scholar]
- 27.López Jaramillo J, et al. High-yield expression of pea thioredoxin m and assessment of its efficiency in chloroplast fructose-1,6-bisphosphatase activation. Plant Physiol. 1997;114(4):1169–1175. doi: 10.1104/pp.114.4.1169. [DOI] [PMC free article] [PubMed] [Google Scholar]
- 28.Okegawa Y, Motohashi K. Chloroplastic thioredoxin m functions as a major regulator of Calvin cycle enzymes during photosynthesis in vivo. Plant J. 2015;84(5):900–913. doi: 10.1111/tpj.13049. [DOI] [PubMed] [Google Scholar]
- 29.Balsera M, Uberegui E, Schürmann P, Buchanan BB. Evolutionary development of redox regulation in chloroplasts. Antioxid Redox Signal. 2014;21(9):1327–1355. doi: 10.1089/ars.2013.5817. [DOI] [PubMed] [Google Scholar]
- 30.Lemaire SD, et al. NADP-malate dehydrogenase from unicellular green alga Chlamydomonas reinhardtii. A first step toward redox regulation? Plant Physiol. 2005;137(2):514–521. doi: 10.1104/pp.104.052670. [DOI] [PMC free article] [PubMed] [Google Scholar]
- 31.Issakidis E, et al. Site-directed mutagenesis reveals the involvement of an additional thioredoxin-dependent regulatory site in the activation of recombinant sorghum leaf NADP-malate dehydrogenase. J Biol Chem. 1992;267(30):21577–21583. [PubMed] [Google Scholar]
- 32.Issakidis E, et al. Identification and characterization of the second regulatory disulfide bridge of recombinant sorghum leaf NADP-malate dehydrogenase. J Biol Chem. 1994;269(5):3511–3517. [PubMed] [Google Scholar]
- 33.Portis AR, Jr, Heldt HW. Light-dependent changes of the Mg2+ concentration in the stroma in relation to the Mg2+ dependency of CO2 fixation in intact chloroplasts. Biochim Biophys Acta. 1976;449(3):434–436. doi: 10.1016/0005-2728(76)90154-7. [DOI] [PubMed] [Google Scholar]
- 34.Krause GH. Light-induced movement of magnesium ions in intact chloroplasts. Spectroscopic determination with Eriochrome Blue SE. Biochim Biophys Acta. 1977;460(3):500–510. doi: 10.1016/0005-2728(77)90088-3. [DOI] [PubMed] [Google Scholar]
- 35.Reyes-Prieto A, Bhattacharya D. Phylogeny of Calvin cycle enzymes supports Plantae monophyly. Mol Phylogenet Evol. 2007;45(1):384–391. doi: 10.1016/j.ympev.2007.02.026. [DOI] [PubMed] [Google Scholar]
- 36.Donahue JL, Bownas JL, Niehaus WG, Larson TJ. Purification and characterization of glpX-encoded fructose 1,6-bisphosphatase, a new enzyme of the glycerol 3-phosphate regulon of Escherichia coli. J Bacteriol. 2000;182(19):5624–5627. doi: 10.1128/jb.182.19.5624-5627.2000. [DOI] [PMC free article] [PubMed] [Google Scholar]
- 37.Jiang Y-H, Wang D-Y, Wen J-F. The independent prokaryotic origins of eukaryotic fructose-1, 6-bisphosphatase and sedoheptulose-1, 7-bisphosphatase and the implications of their origins for the evolution of eukaryotic Calvin cycle. BMC Evol Biol. 2012;12:208. doi: 10.1186/1471-2148-12-208. [DOI] [PMC free article] [PubMed] [Google Scholar]
- 38.Ku C, et al. Endosymbiotic origin and differential loss of eukaryotic genes. Nature. 2015;524(7566):427–432. doi: 10.1038/nature14963. [DOI] [PubMed] [Google Scholar]
- 39.Williams TA, Foster PG, Cox CJ, Embley TM. An archaeal origin of eukaryotes supports only two primary domains of life. Nature. 2013;504(7479):231–236. doi: 10.1038/nature12779. [DOI] [PubMed] [Google Scholar]
- 40.Gould SB, Waller RF, McFadden GI. Plastid evolution. Annu Rev Plant Biol. 2008;59:491–517. doi: 10.1146/annurev.arplant.59.032607.092915. [DOI] [PubMed] [Google Scholar]
- 41.Jacquot J-P, Lancelin J-M, Meyer Y. Thioredoxins: Structure and function in plant cells. New Phytol. 1997;136(4):543–570. doi: 10.1046/j.1469-8137.1997.00784.x. [DOI] [PubMed] [Google Scholar]
- 42.Arnold FH, Wintrode PL, Miyazaki K, Gershenson A. How enzymes adapt: Lessons from directed evolution. Trends Biochem Sci. 2001;26(2):100–106. doi: 10.1016/s0968-0004(00)01755-2. [DOI] [PubMed] [Google Scholar]
- 43.Feller G, Gerday C. Psychrophilic enzymes: Hot topics in cold adaptation. Nat Rev Microbiol. 2003;1(3):200–208. doi: 10.1038/nrmicro773. [DOI] [PubMed] [Google Scholar]
- 44.Gatti-Lafranconi P, et al. Evolution of stability in a cold-active enzyme elicits specificity relaxation and highlights substrate-related effects on temperature adaptation. J Mol Biol. 2010;395(1):155–166. doi: 10.1016/j.jmb.2009.10.026. [DOI] [PubMed] [Google Scholar]
- 45.Tamoi M, Nagaoka M, Yabuta Y, Shigeoka S. Carbon metabolism in the Calvin cycle. Plant Biotechnol. 2005;22(5):355–360. [Google Scholar]
- 46.Hodges M, et al. Purification and characterization of pea thioredoxin f expressed in Escherichia coli. Plant Mol Biol. 1994;26(1):225–234. doi: 10.1007/BF00039534. [DOI] [PubMed] [Google Scholar]
- 47.Stein M, et al. Chlamydomonas reinhardtii thioredoxins: Structure of the genes coding for the chloroplastic m and cytosolic h isoforms; expression in Escherichia coli of the recombinant proteins, purification and biochemical properties. Plant Mol Biol. 1995;28(3):487–503. doi: 10.1007/BF00020396. [DOI] [PubMed] [Google Scholar]
- 48.Zimmer AD, et al. Reannotation and extended community resources for the genome of the non-seed plant Physcomitrella patens provide insights into the evolution of plant gene structures and functions. BMC Genomics. 2013;14:498. doi: 10.1186/1471-2164-14-498. [DOI] [PMC free article] [PubMed] [Google Scholar]
- 49.Waterhouse AM, Procter JB, Martin DMA, Clamp M, Barton GJ. Jalview version 2—A multiple sequence alignment editor and analysis workbench. Bioinformatics. 2009;25(9):1189–1191. doi: 10.1093/bioinformatics/btp033. [DOI] [PMC free article] [PubMed] [Google Scholar]
- 50.Ronquist F, Huelsenbeck JP. MrBayes 3: Bayesian phylogenetic inference under mixed models. Bioinformatics. 2003;19(12):1572–1574. doi: 10.1093/bioinformatics/btg180. [DOI] [PubMed] [Google Scholar]
- 51.Frank W, Decker EL, Reski R. Molecular tools to study Physcomitrella patens. Plant Biol (Stuttg) 2005;7(3):220–227. doi: 10.1055/s-2005-865645. [DOI] [PubMed] [Google Scholar]
- 52.Kabsch W. XDS. Acta Crystallogr D Biol Crystallogr. 2010;66(Pt 2):125–132. doi: 10.1107/S0907444909047337. [DOI] [PMC free article] [PubMed] [Google Scholar]
- 53.Winn MD, et al. Overview of the CCP4 suite and current developments. Acta Crystallogr D Biol Crystallogr. 2011;67(Pt 4):235–242. doi: 10.1107/S0907444910045749. [DOI] [PMC free article] [PubMed] [Google Scholar]
- 54.Vagin A, Teplyakov A. Molecular replacement with MOLREP. Acta Crystallogr D Biol Crystallogr. 2010;66(Pt 1):22–25. doi: 10.1107/S0907444909042589. [DOI] [PubMed] [Google Scholar]
- 55.Emsley P, Lohkamp B, Scott WG, Cowtan K. Features and development of Coot. Acta Crystallogr D Biol Crystallogr. 2010;66(Pt 4):486–501. doi: 10.1107/S0907444910007493. [DOI] [PMC free article] [PubMed] [Google Scholar]
- 56.Murshudov GN, Vagin AA, Dodson EJ. Refinement of macromolecular structures by the maximum-likelihood method. Acta Crystallogr D Biol Crystallogr. 1997;53(Pt 3):240–255. doi: 10.1107/S0907444996012255. [DOI] [PubMed] [Google Scholar]
- 57.Chen VB, et al. MolProbity: All-atom structure validation for macromolecular crystallography. Acta Crystallogr D Biol Crystallogr. 2010;66(Pt 1):12–21. doi: 10.1107/S0907444909042073. [DOI] [PMC free article] [PubMed] [Google Scholar]
- 58.Krieger E, et al. Improving physical realism, stereochemistry, and side-chain accuracy in homology modeling: Four approaches that performed well in CASP8. Proteins. 2009;77(Suppl 9):114–122. doi: 10.1002/prot.22570. [DOI] [PMC free article] [PubMed] [Google Scholar]
- 59.Weiss MS. Global indicators of X-ray data quality. J Appl Chrystallogr. 2001;34(2):130–135. [Google Scholar]
Associated Data
This section collects any data citations, data availability statements, or supplementary materials included in this article.


